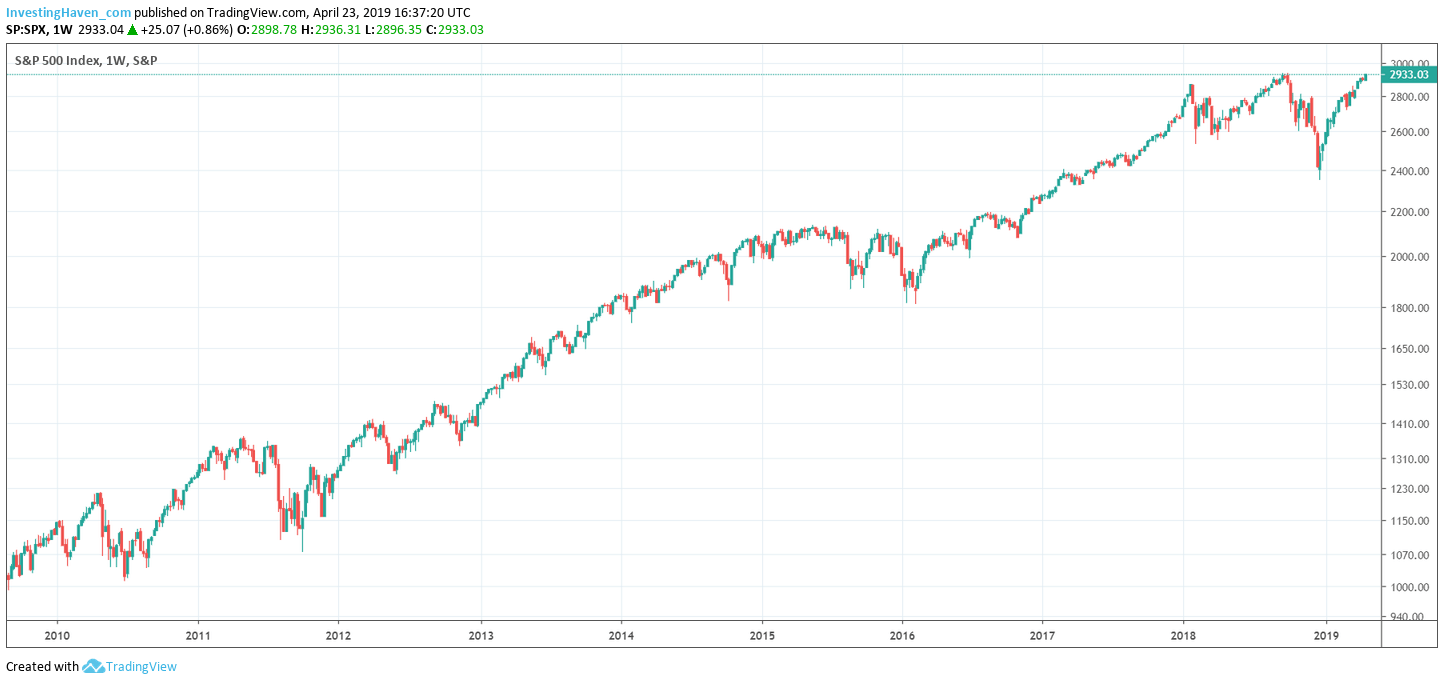
A historic moment for stock markets. The S&P 500 is attempting a triple top breakout. Its long term chart shows how the double 2018 tops are being ‘tested’ as we speak. Are U.S. stocks going higher from here, or is this the absolute top and can we expect a stock market crash in 2019? What do our 15 leading indicators for global market trends reveal?
The long term S&P 500 chart says it all.
This is one of the exceptional occasions in which we do not need to annotate a chart.
The triple top is the most obvious observation on this chart. The question is to whether this is a triple top resistance or a triple top breakout.
Interestingly, we do not believe the S&P 500 chart itself has the answer to this question!

On the contrary, we tend to believe that other charts have the answer to the question asked above.
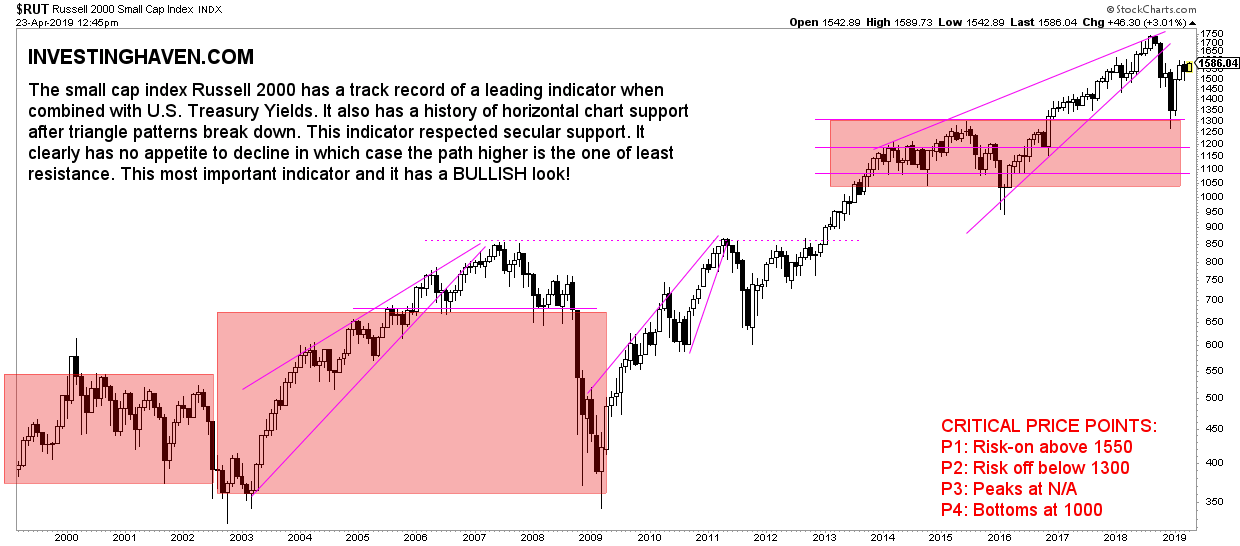
We consider the Russell 2000 a leading indicator for future price direction together with the Euro and U.S. interest rates.
As said last week the Euro as a leading indicator does not have a negative effect on stock markets. We do not consider the Euro to be working ‘against’ stock markets.
The Russell 2000 has a different look. It is not yet at all-time highs. So there are 2 ways to look at this:
- The Russell 2000 is the laggard which means it is catching up with some delay.
- The Russell 2000 is setting a lower high against its all-time highs, somehow similar to 2007 / 2008. This would result in an inability to go structurally higher from here.
Benefit of the doubt to the bulls. We don’t think a 2008 or 1987 is brewing. As per our intermarket charts the situation today is somehow different, with no red flags similar to what we described here: 5 Shocking Charts From 1987: No Similar Market Crash In 2019.
For now, we consider U.S. stock markets rising. We closely watch the Russell 2000 at 1300 points which we consider a major turning point!


