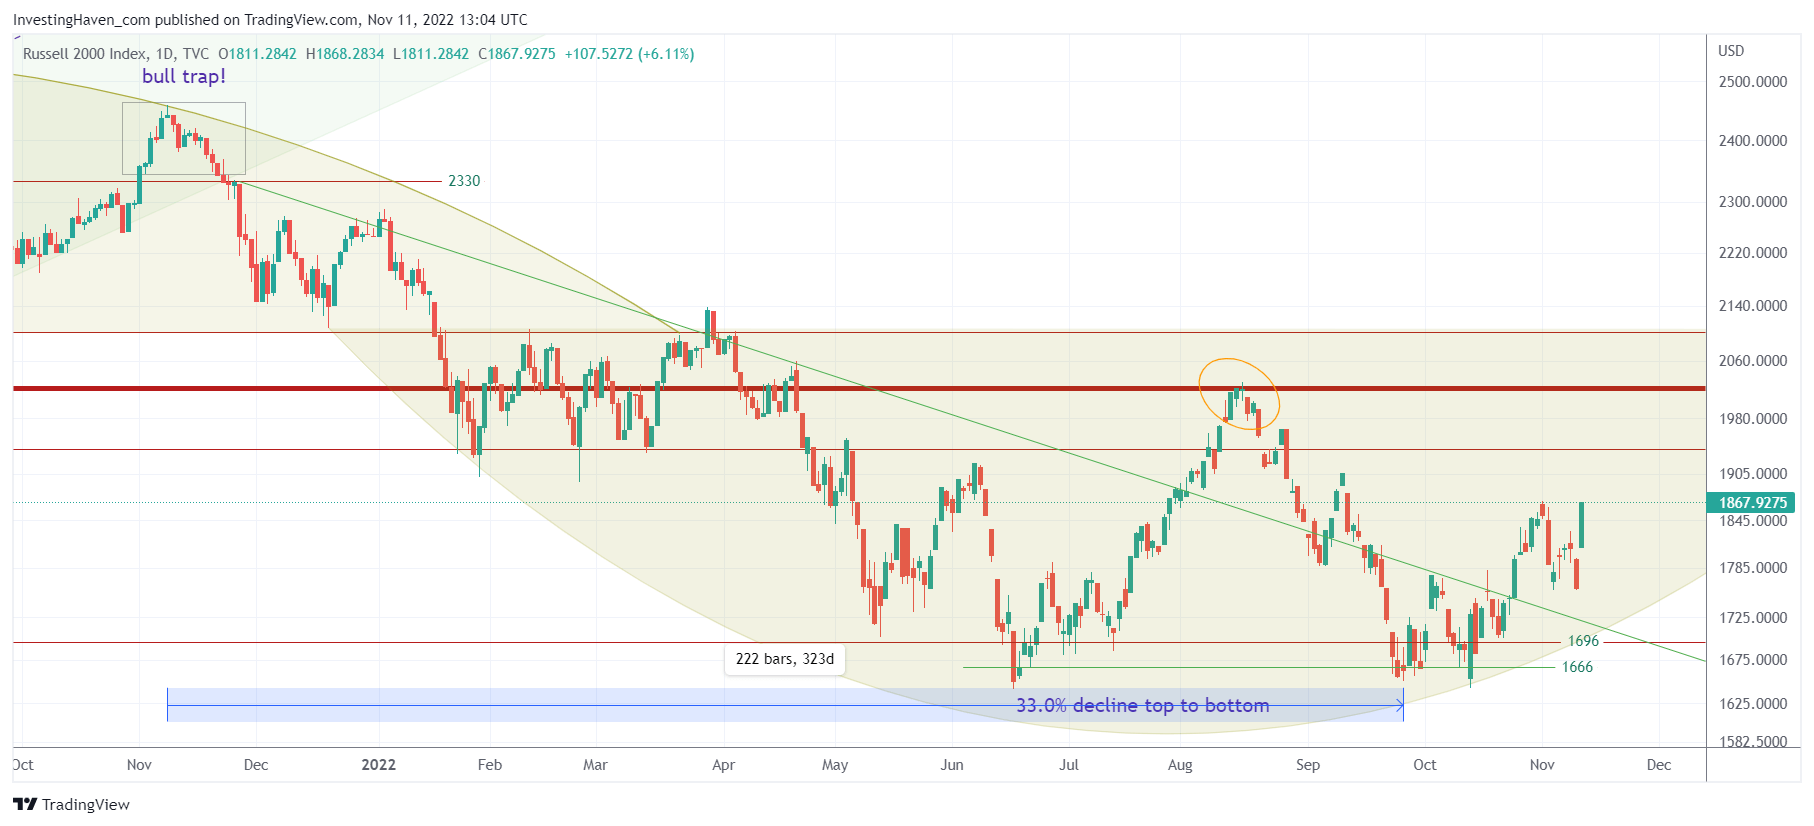
Markets have bottomed, we said so when markets started breaking down on Thu Oct 13th in The Market Will Not Move 50% Lower Contrary To What The Gurus Are Telling You. The entire investor community was ultra-bearish and calling for the start of a stock market crash. We were saying: “opportunities ahead” because that’s what our 2023 forecasts were suggesting: an opportunity in stocks as per the Dow 100 year chart findings, an opportunity in silver in 2023, an epic opportunity in lithium stocks in 2023 as well as undervalued quality graphite stocks (part of the super cycle in green battery metals).
The big problem for market participants is bias. We explained this in great detail in 7 Secrets of Successful Investing. Applied to markets in 2022, the bias was to the downside. That’s because of the effect on investors’ mind created by the chart we featured in A Different Perspective On Nasty The Stock Market Cycle Of 2022.
Watch out with bias and consensus, the market knows this and will often turn into a different direction when stretched levels of consensus have been reached.
Here is one leading indicator, among many more that we weekly report on in our stock market research service Momentum Investing, which is very reliable in forecasting future stock market moves: the Russell 2000 index chart.
Just to be clear, this is a leading indicator, we are not interested in trading this instrument.
What do you observe on this chart?
- Price axis: The double bottom which perfectly held (1666 on this chart).
- Timeline: Top to bottom, exactly 222 days.
- Lots of harmony between price and time, the two axes of a chart.
With that said, we believe stock picking will be ultra important now going forward. Also, we have to allow sufficient time to the market to show new trends.


