Stock markets are in great shape lately. This comes after the fastest decline ever in 203 years of history of stock markets. Is this surge going to continue? Are markets rising to meet our Dow Jones Forecast For 2020 And 2021? Or do we expect a continuation of the crash?
First of all, we included up to date charts in our Dow Jones articles:
The Dow Jones Historical Chart On 100 Years *Corona Crash Update*
Dow Jones Long Term Chart on 20 Years *Corona Crash Update*
Both are worth your time.
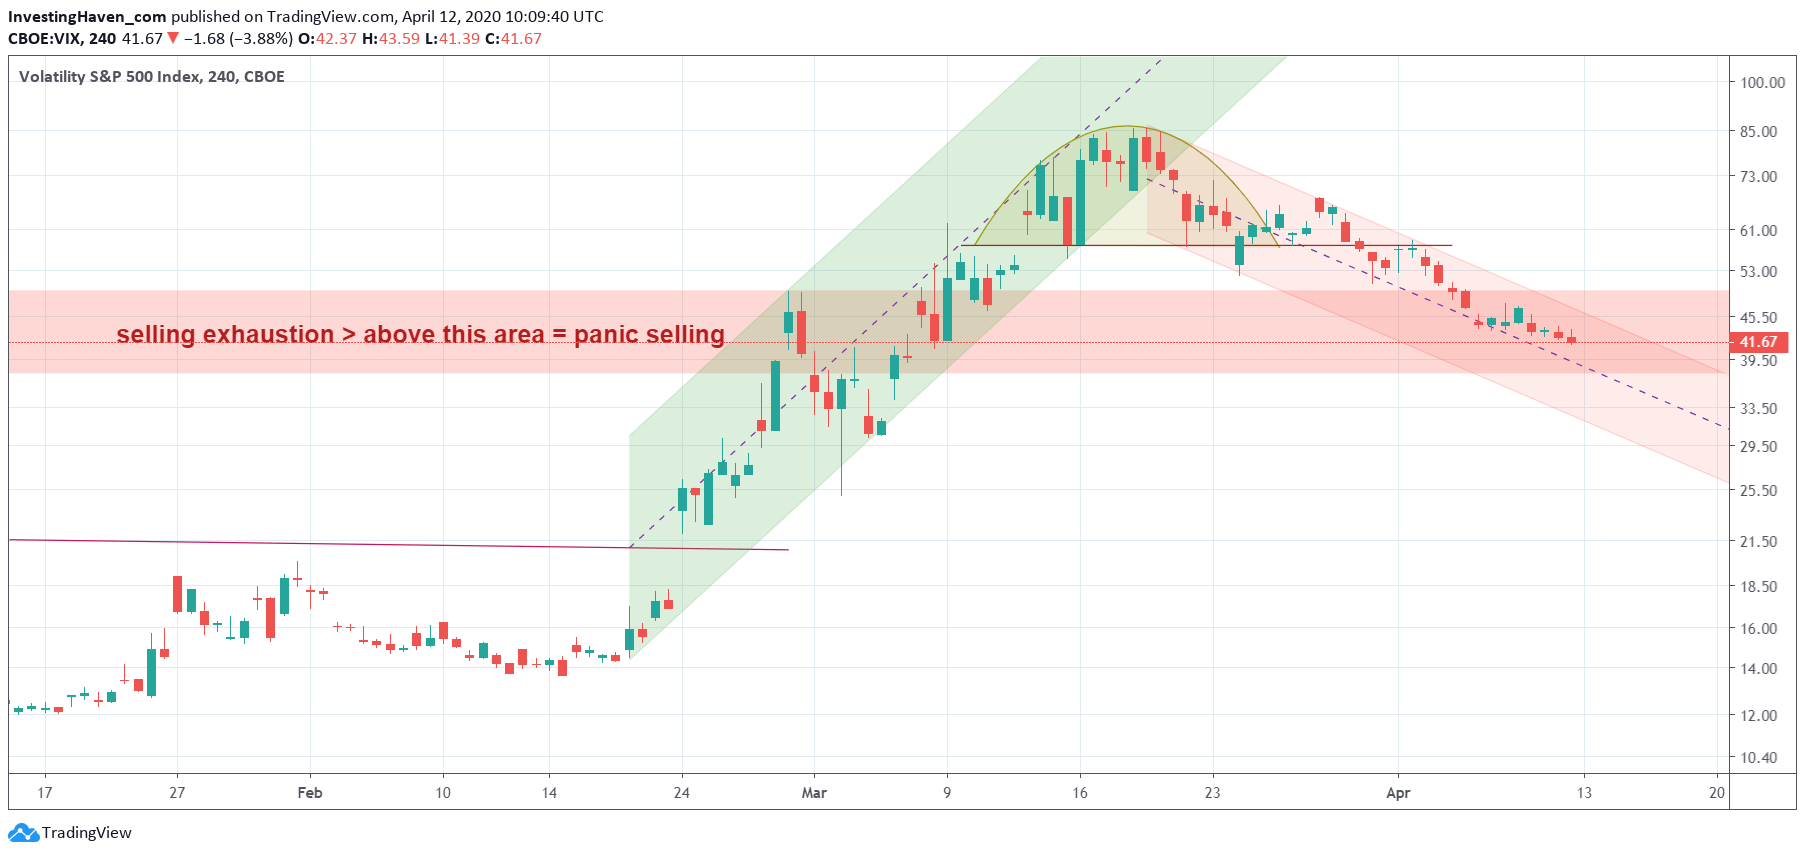
Second, and more importantly, the current leading crash indicators and their message. We look at VIX even though we track multiple indicators in our methodology. We require a short term timeframe though, so this is the 4h chart which allows us to zoom in and find micro trends that may grow big.
All we can see on the chart of our VIX indicator is (1) a falling trend (2) a breach of 50 points as it kept on falling lately (3) close to fall below 39 points.
In other words VIX is moving in one direction which is down (bullish for stocks), and in doing so it is about to fall below the 39-50 points area which defines the ‘armaggedon’ area (once above 39-50 particularly).
Surprising, but true, VIX is close to confirm a bullish continuation of the surge in stock markets.


