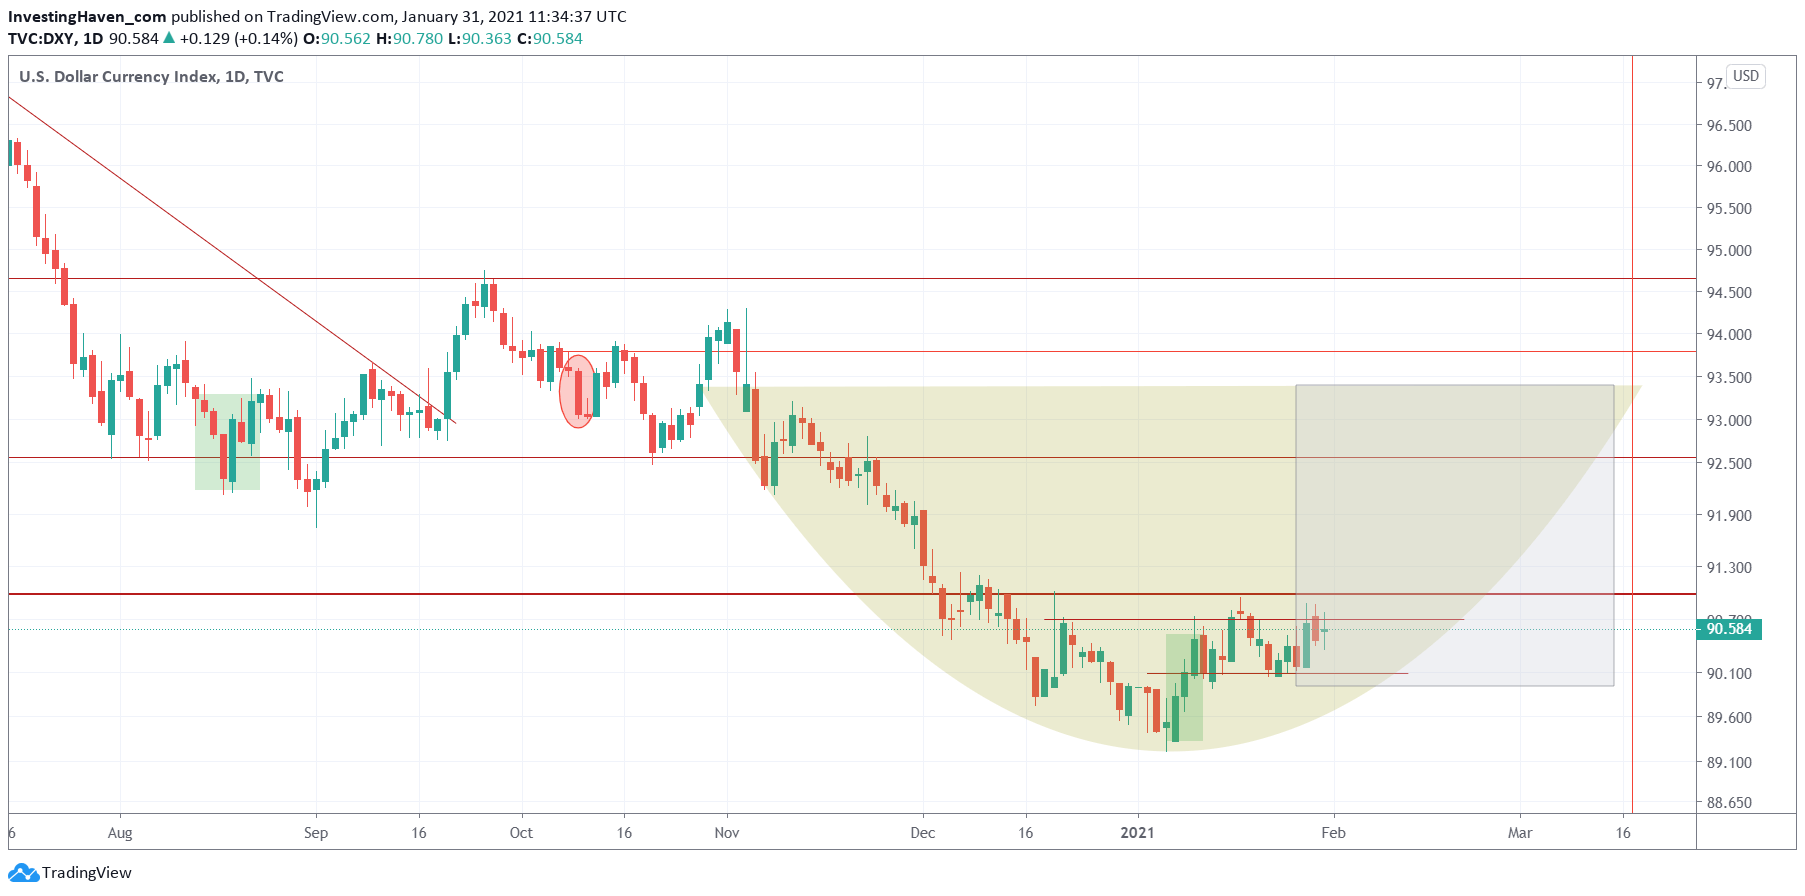
Exactly one week ago we sent a warning to our followers about the USD chart that is about to push stock markets lower. It happened, exactly as expected. Now, one week later, we see that the USD still didn’t break out, it only improved its profile. Next week will be interesting, and we are only more convinced that our bearish February forecast will materialize.
In our update on week ago we said this: “It starts looking really bullish on the medium term timeframe … and that is potentially bearish for risk assets like stocks. This chart setup suggests that the bullish outcome of this reversal is about to start … any time as of NOW. Better don’t ignore this chart.”
Source: ‘Watchout Chart’ For February 2021: US Dollar
In terms of the chart, we indicated that the large grey box (also visible on below chart which is an up-to-date version of the one shared in the article last week) represents the time period in which we believe the USD will be rising.
Needless to say, the bullish reversal of the USD is only getting stronger. And what’s intersting, not visible on this version of the chart, is that we noticed a very powerful trendline on the medium to long term timeframe.
Once the USD crosses 91 points on a daily open and closing basis it will be the ultimate confirmation of a bearish bias that will bring good volatility in February.
Our premium research will contain details on when we expect bearish momentum to disappear, and when bullish positions can be opened more aggressively. Forecasting the exact start and end dates of bearish periods is exactly what we want to master in 2021. We, over here at InvestingHaven, did select our focus area for 2021: mastering consolidations.
As per our must-read guide 99 Common Mistakes To Avoid As Investors:
Point 99: You can and should actively work with all materials outlined in this document. Some will be more relevant than others, some should become your focus area in 2021 and some others beyond 2021. Be focused, and spread your own training over time.
It is not so difficult to spot a bullish or bearish trend, it is on the contrary extremely challenging to spot those trend changes! And they really hold the key to success.
Every investor has to work hard, and this applies to ourselves in the first place. It is wise to choose a certain area in which you want to focus each and every year.


