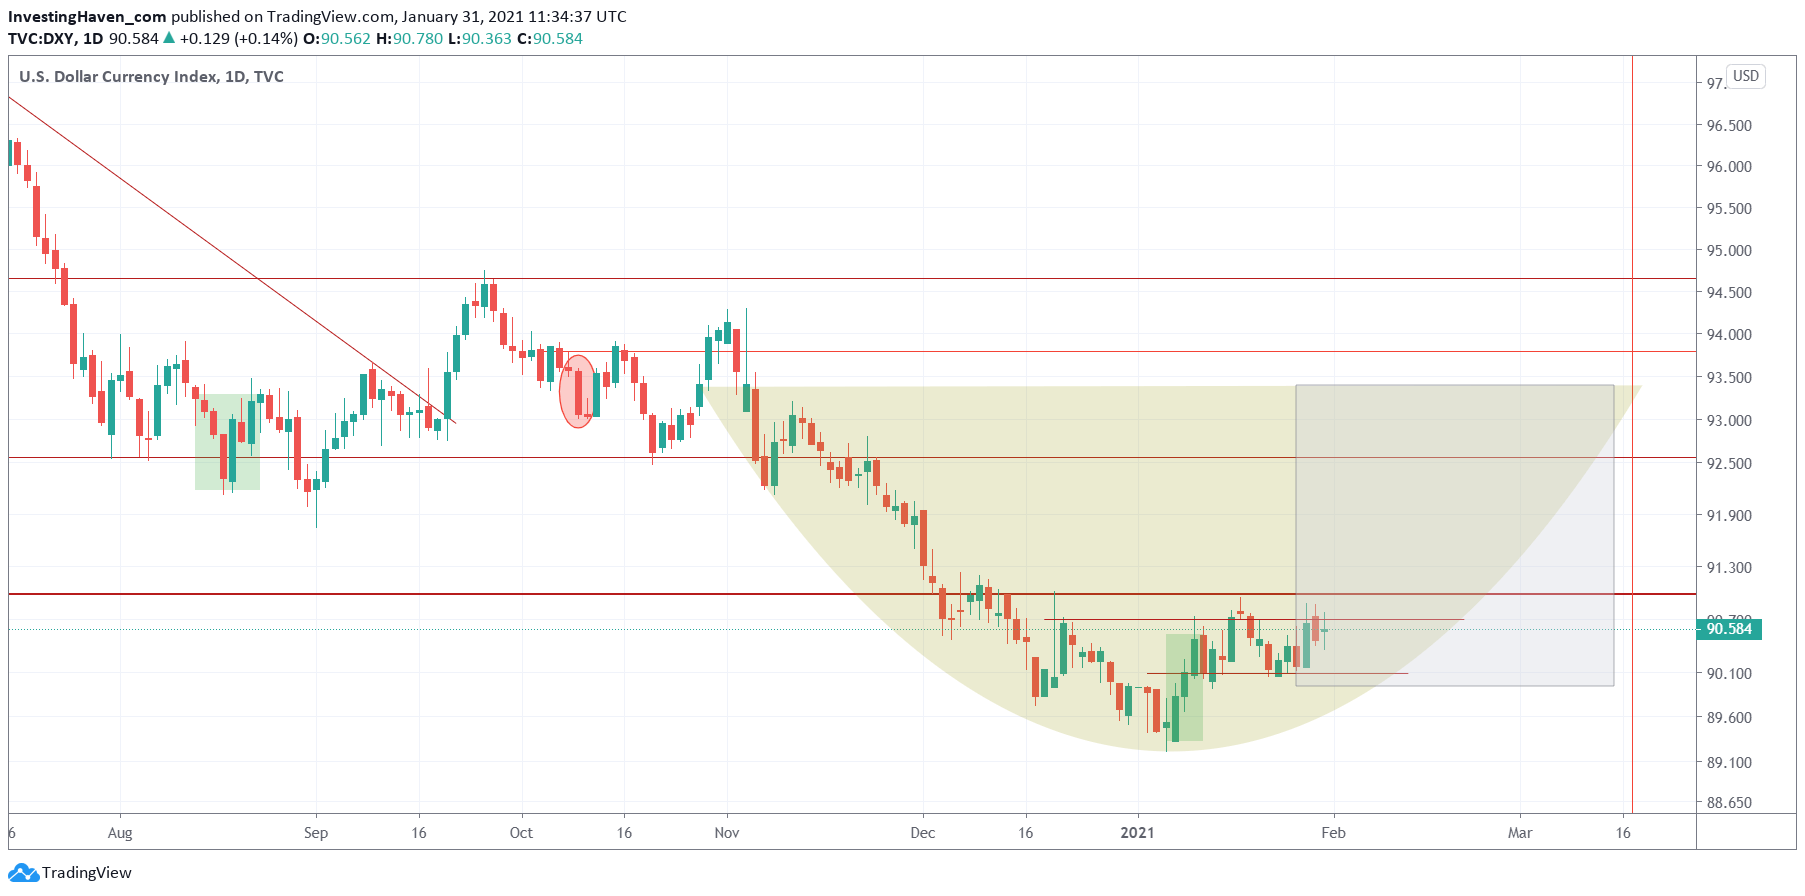
A few weeks ago we started focusing on the USD chart, and called it the ‘watchout chart’ of the month of February. A rising USD is not good for stocks. Last weekend, we pointed out that the USD was becoming more bullish, and we should increase protection levels for our open positions. It turned out that bulls crushed bears, as the USD found some good resistance. We wouldn’t discount the risk of the USD. However, we clearly see too much bullish power in this market, which we can’t discount neither. The USD risk is postponed, to later in February or March.
This is what we wrote last weekend’s update:
Needless to say, the bullish reversal of the USD is only getting stronger. And what’s intersting, not visible on this version of the chart, is that we noticed a very powerful trendline on the medium to long term timeframe.
Once the USD crosses 91 points on a daily open and closing basis it will be the ultimate confirmation of a bearish bias that will bring good volatility in February.
And this is the USD daily chart from one week ago. We marked the area in grey as the area in which a retracement in stocks is likely going to take place, because that when the USD will show strength.
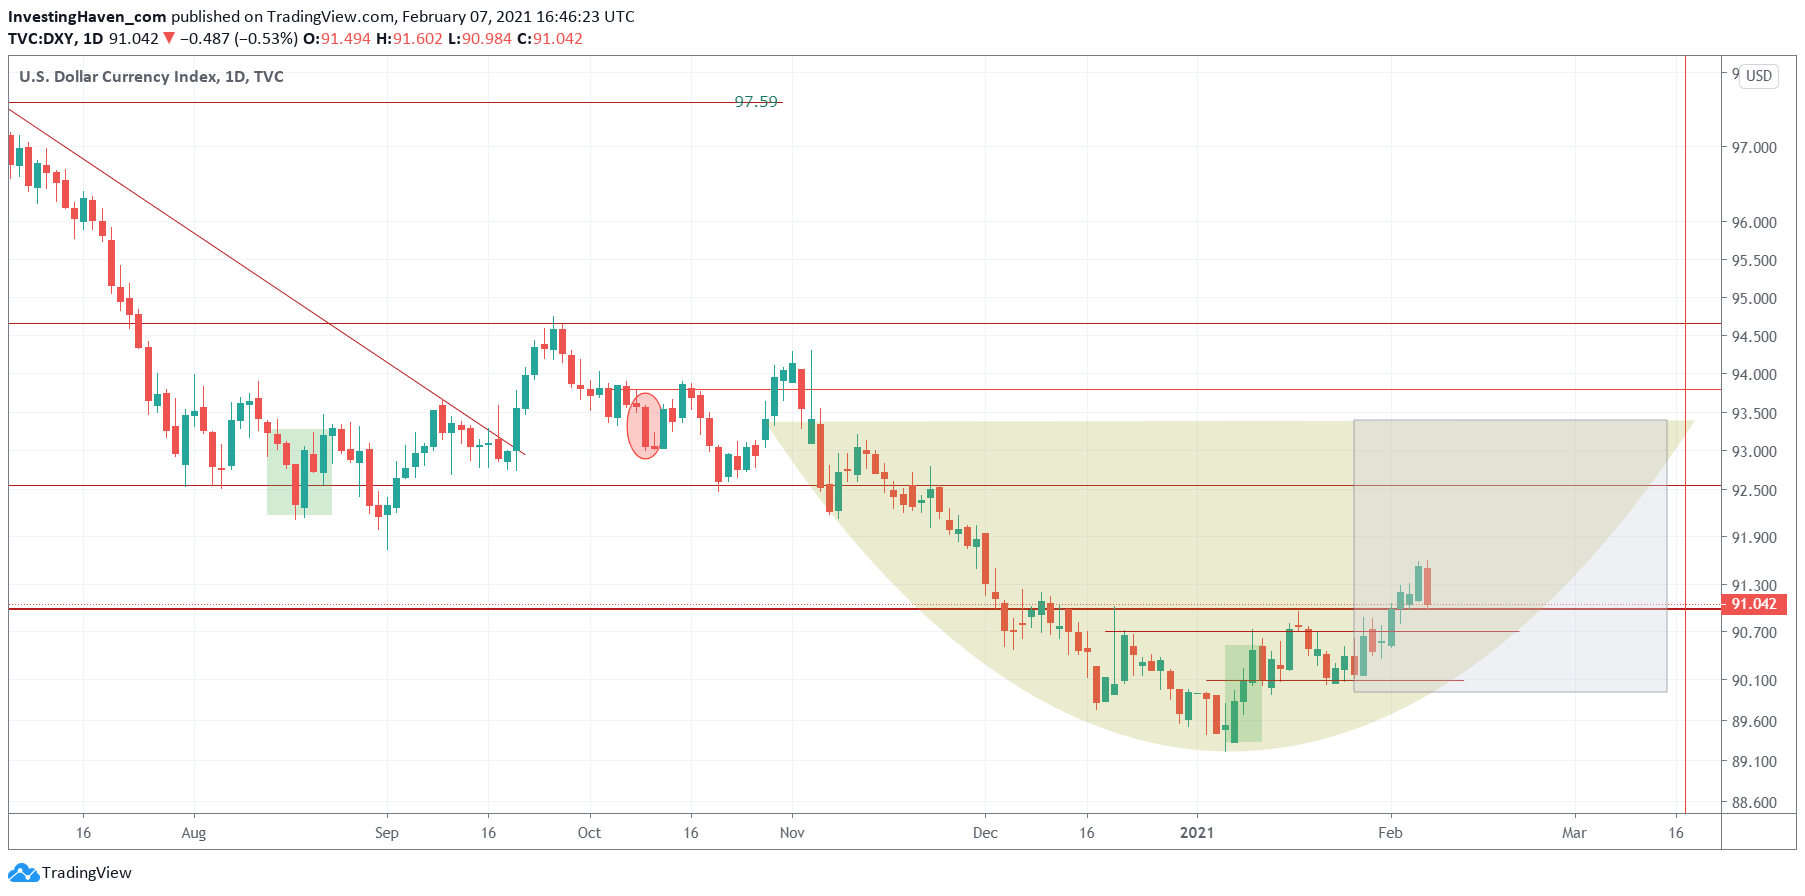
 Fast forward to today (Friday’s closing prices), and we see this daily USD chart:
This chart is turning more bullish. However, we can’t ignore that stock bulls took over control last week, and whatever is bullish in the USD chart did not have any effect whatsoever.
For now, we believe that the USD needs a little bit more time to create any harm to markets. Stock bulls in control, undeniably, until proven otherwise. And a 30% market crash is not what we read in this chart.


