In this article we include the VIX as one of the many charts featured in our premium services, particularly because it looks very promising and it may underpin our bullish thesis for our current holdings as well as the profit potential for our short term trades.
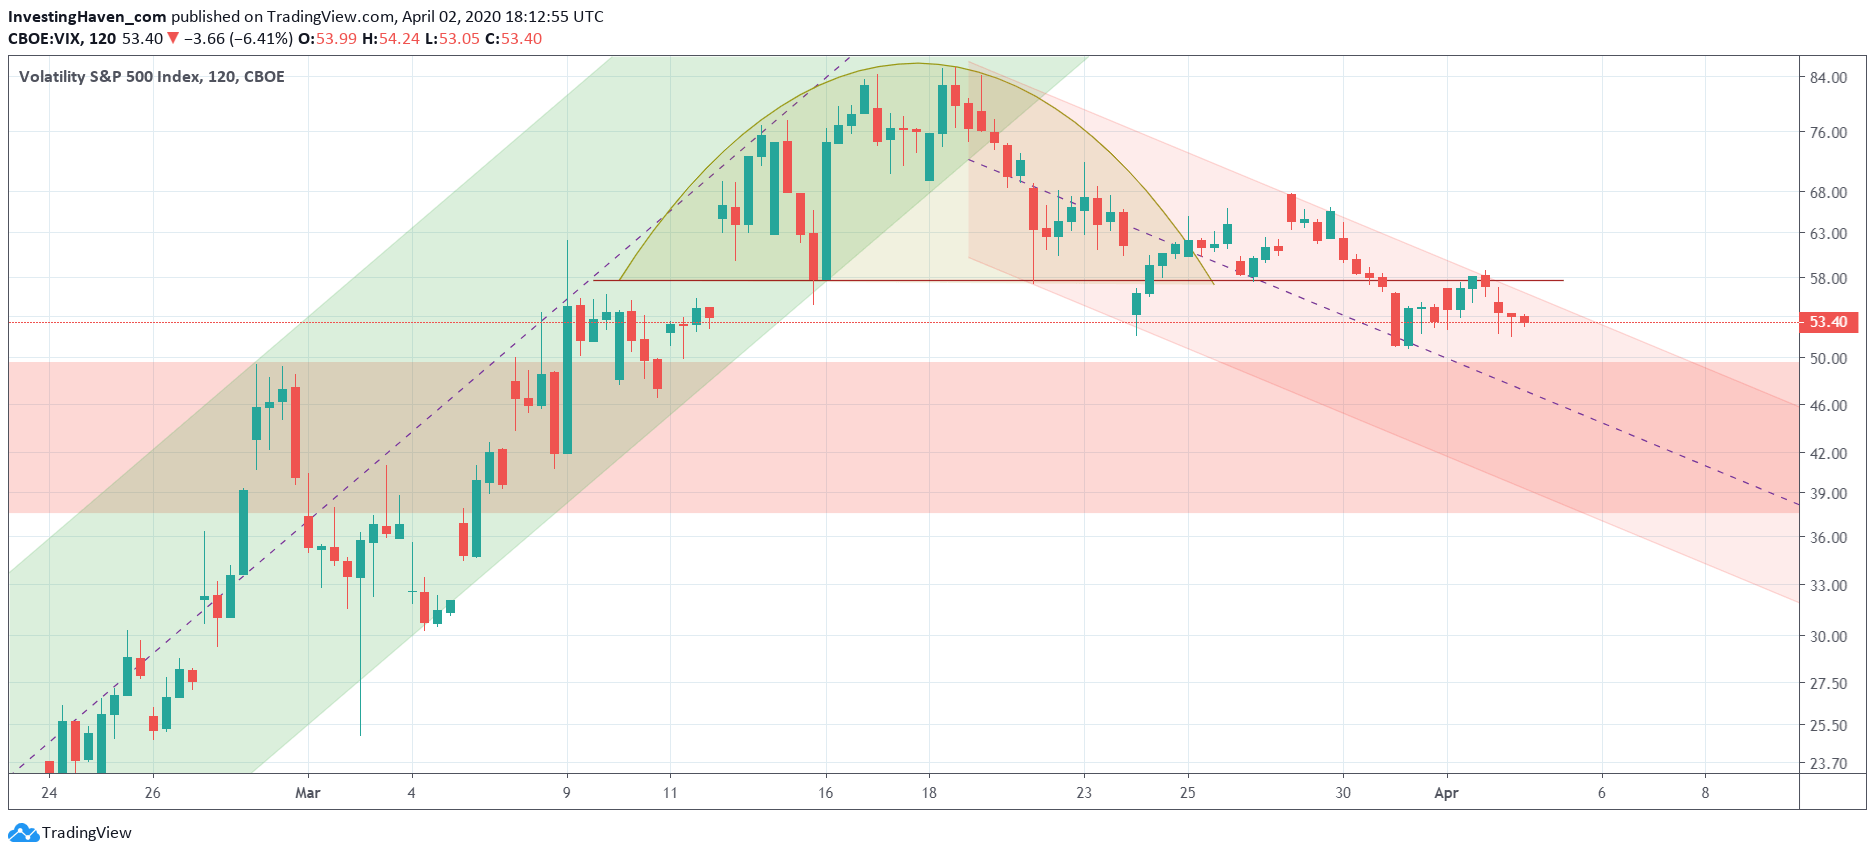
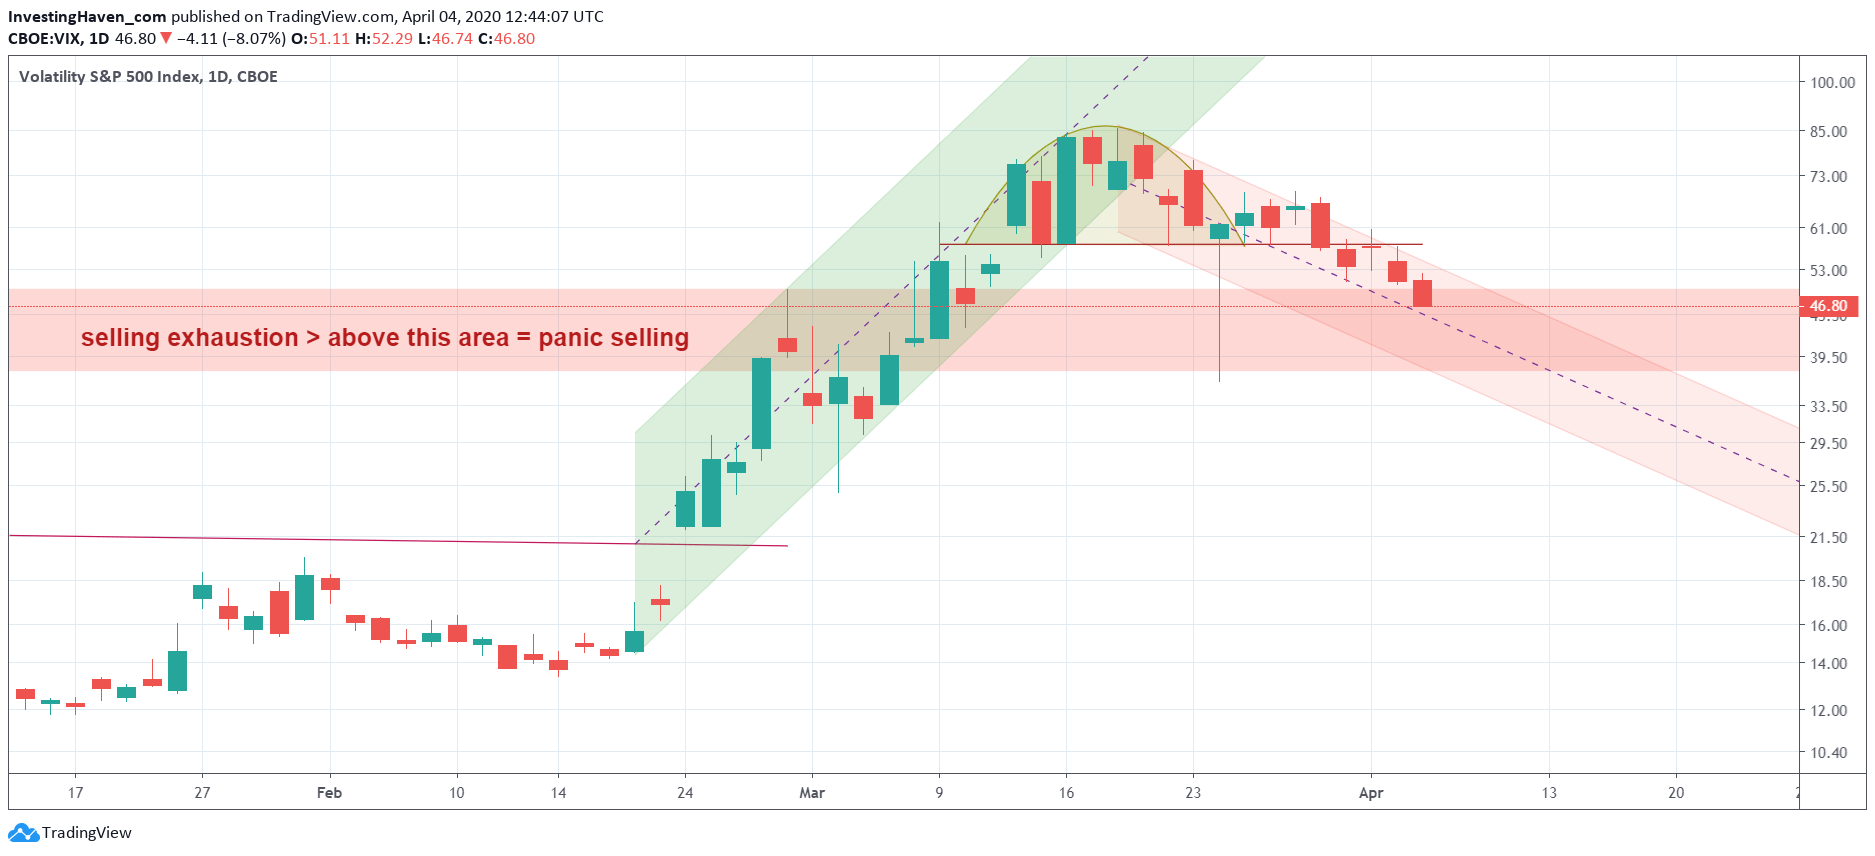
Let’s face it: as long as VIX moves above the crucial 50 points level it is in ‘armaggedon’ area.
Today we witnessed a serious retracement in the VIX index. It even closed right at 50 points, even lower than we took the snapshot of the chart embedded in this article.
We observe that VIX now moves in a falling channel. That’s after it went up steeply between February 24th and March 18th, leading to the once-in-a-generation crashes we witnessed in March of 2020.
As long as VIX falls in the red falling channel it will unleash energy for stock markets to go up. It would create the ideal environment for our short term trades to do extremely.
With the ongoing trend we expect ‘less volatility ahead’, especially if VIX falls into the lower part of this red falling channel.
[Ed. note: added on Sunday April 5th]
The updated chart on April 3d, 2020:


