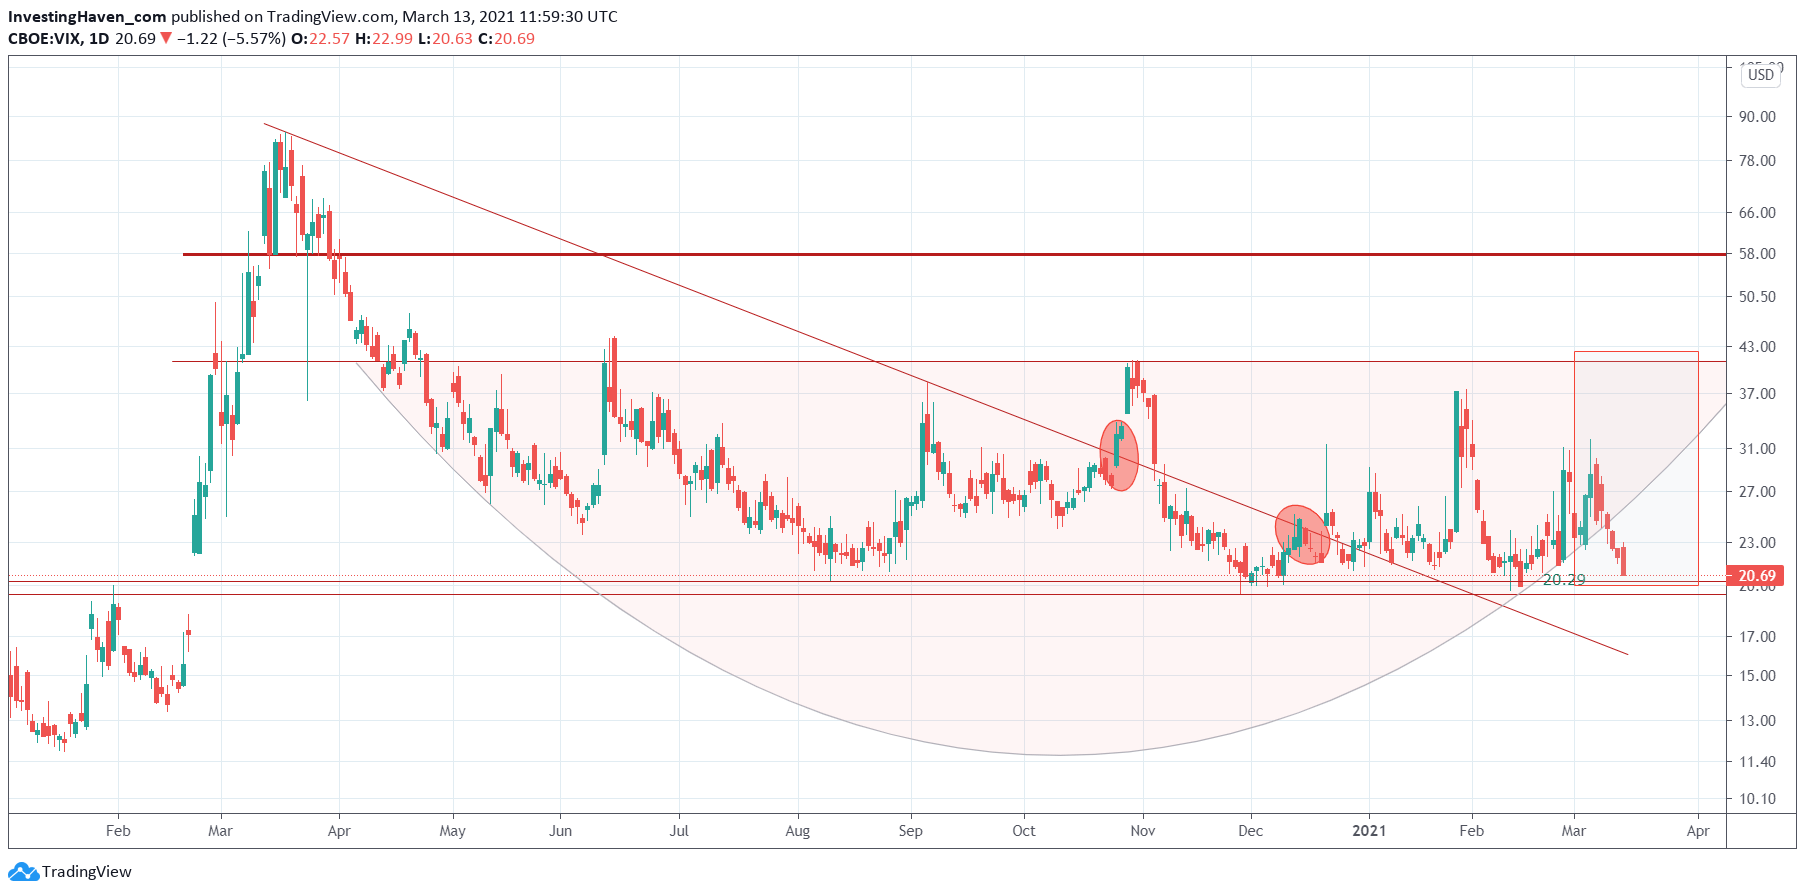
Loyal readers know by now that we spend a lot of time analyzing crash indicators to understand how much ‘push back’ markets will have on the short and medium term. The volatility index VIX is one of the 5 indicators we use in our ‘crash indicator’ analysis. The VIX chart, if anything, tells us that it has a tough time pushing back on markets.
The most interesting observation of last week is sector rotation … on steroids!
One of the few mainstream financial media articles that drew our attention this week:
Dow ends at a record high while Nasdaq remains in correction — That hasn’t happened in 20 years (Marketwatch)
They wrote that the Nasdaq has been under pressure since its record high in mid-February as the rotation out of technology and growth stocks gathered pace as bond yields rose on fears of inflation and quick economic growth in 2021 after the passage by Congress of a $1.9 trillion fiscal stimulus bill.
Quote 1:
The rally in the Dow has been powered by industrials like Boeing Co., drugstore chains like Walgreens Boots Alliance Inc., and home-improvement chains like Home Depot, which have been benefiting from the so-called reopening trade as investors shift their focus from technology companies that did well during the pandemic to those that might perform better as the economy recovers further.
Quote 2:
On Wednesday Congress finalized the sixth coronavirus relief bill and sent it to President Biden for his signature, with Democrats including an expansive round of payments to households, businesses and local governments without any Republican party support.
The take-aways:
- Sector rotation is in progress.
- Capital has been flowing out of tech into industrials primarily (but not only).
- Helicopter money (stimulus bill) is likely going to flow to households / consumer goods.
- Equally important, we see that sector rotation is moving fast, very fast … with quick rises (like last week e.g. in industrials) but also very quick decline (tech and commodities in recent weeks).
Sector rotation on steroids! We wrote about this in much more detail in our weekend update to our members, and identified several stocks that are ready to move (strongly) higher.
As all this sector rotation was happening, last week, the volatility index gave up. This may mean that the sell off which happened in some momentum sectors (EVs, fuel cell, pot stocks, commodities) is over … for now. It also suggests that the VIX index might open the door for more buying … but only in some select sectors … until VIX breaks below 20 points which is when all markets will do well.


