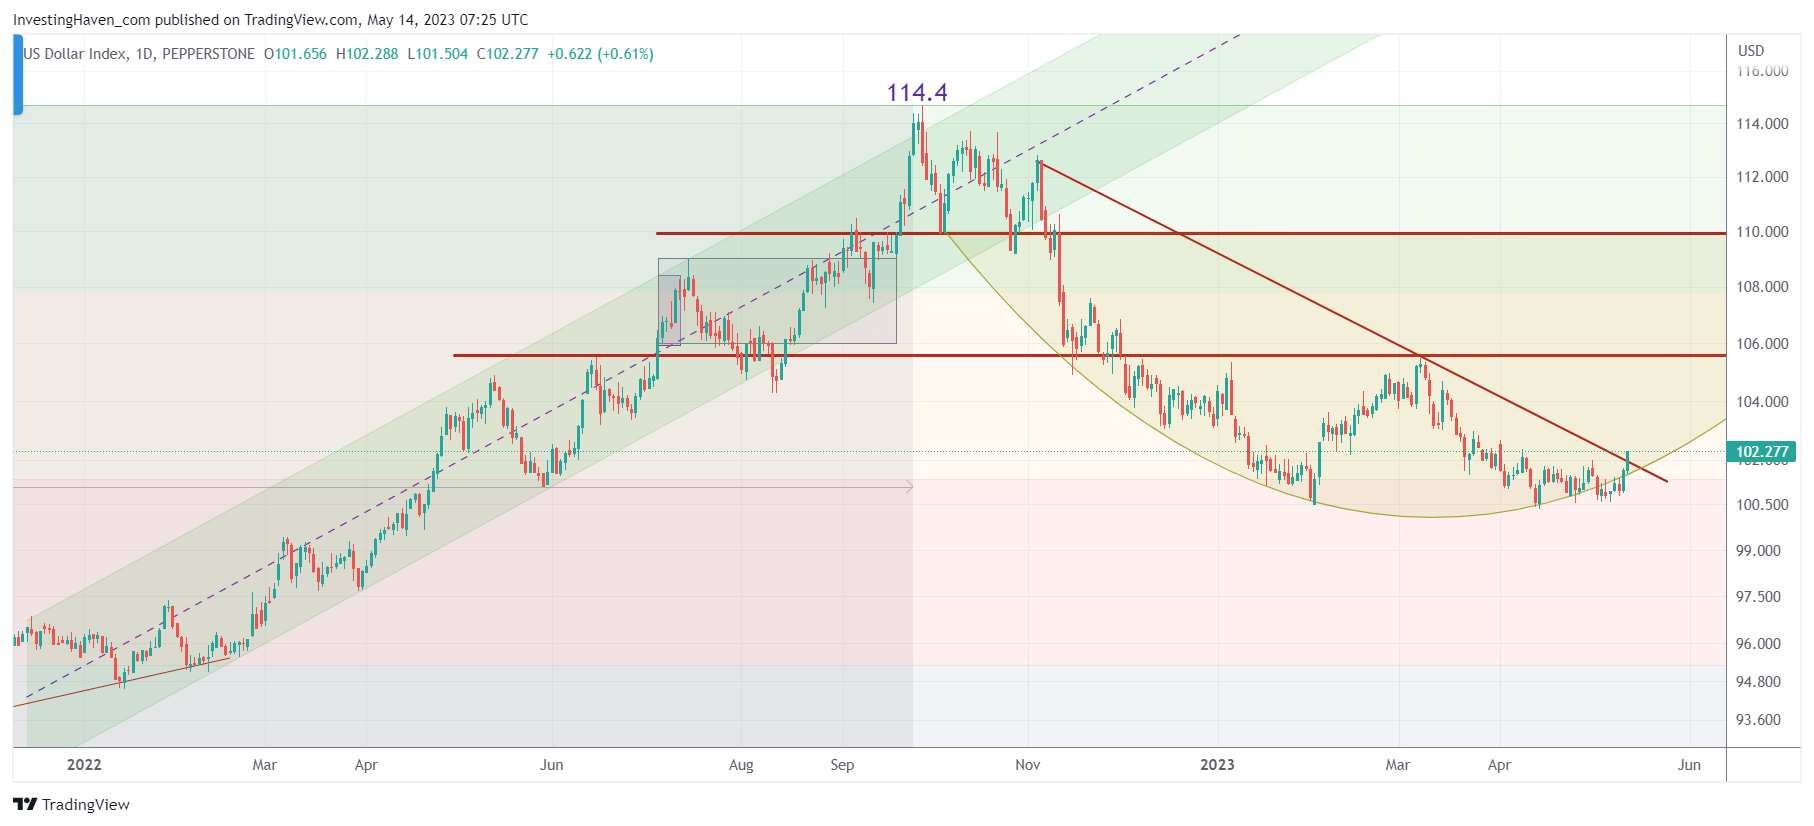
The U.S. Dollar started rising on Thursday. This should not come as a surprise, given a pending debt ceiling deadline in the U.S. The more important question is how high the U.S. Dollar can rise, and how it will impact metals and markets (also BTC). In this article, we share a high level forecast as it relates to markets and metals (gold and silver). We remain optimistic in our general outlook for 2023, however we also expect periods of volatility like the one coming up, short-lived probably.
As a research team of chartists, our focus lies in uncovering insights from various market charts. Today, we delve into the US Dollar (USD) chart, highlighting its significance and intermarket influences. Understanding the USD chart is vital, as it often exhibits a negative correlation with risk assets such as stocks and commodities. In this article, we will analyze the chart structure and conclude that the USD pattern is creating a bullish structure, potentially leading to a 3% and 7% increase in the near future.
Importance of Analyzing the USD Chart
The USD chart carries substantial intermarket influences, playing a crucial role in global financial markets. Historically, the USD has shown a negative correlation with risk assets. During times of market uncertainty or heightened risk aversion, investors tend to seek the relative safety of the US Dollar, causing it to strengthen. Conversely, when market sentiment improves, the USD tends to weaken as investors seek higher-yielding assets.
For instance, during the global financial crisis of 2008, the USD experienced a significant rally as investors sought refuge amid the market turmoil. Conversely, when risk appetite returned during the recovery phase, the USD weakened as investors ventured into riskier assets, such as stocks and commodities. This historical relationship highlights the importance of analyzing the USD chart as a leading indicator for overall market sentiment, but only if there is a strong and outspoken trend (higher or lower) on the USD chart.
The message of the U.S. Dollar chart
Turning our attention to the USD chart since early 2022, we observe a strong uptrend depicted by the rising green channel. The peak was reached in October 2022, followed by a substantial decline. However, recent price action suggests the formation of a potential double bottom pattern between February and May 2023, spanning a three-month period.
Two prominent chart patterns come into play: the rounded pattern and the falling trendline. The rounded pattern indicates a potential bullish reversal, suggesting a shift in market sentiment favoring the USD. This pattern, characterized by a rounded base followed by an upward move, often signals a change in trend from bearish to bullish.
Additionally, the falling trendline represents a significant resistance level that the USD needs to overcome. As the USD chart progresses, a successful breakout above this trendline would further validate the bullish scenario and open the path for further upside potential.
Conclusion
In conclusion, our analysis of the USD chart reveals a bullish structure, signaling potential upside in the coming months. Based on our assessment, we anticipate an immediate target of 105.5 points, representing a 3% increase from the current level. Furthermore, the USD has the potential to reach a secondary target of 109.8 points, a 7% increase, either in the short term or later this year. We expect the U.S. Dollar to confirm a local top in markets and temporarily make it tougher for precious metals to rise, although there are other supportive leading indicators for precious metals which lead us to conclude that precious metals will witness a short-lived pullback.


