Volatility is starting to show its ugly head. Last week we got an ‘entertaining show’ of the VIX index, and it was near crash levels. We warned about this in VIX + USD = An Ugly Cocktail For Markets In September. The risk is not over yet, going into October we have to carefully monitor one specific level in volatility index VIX.
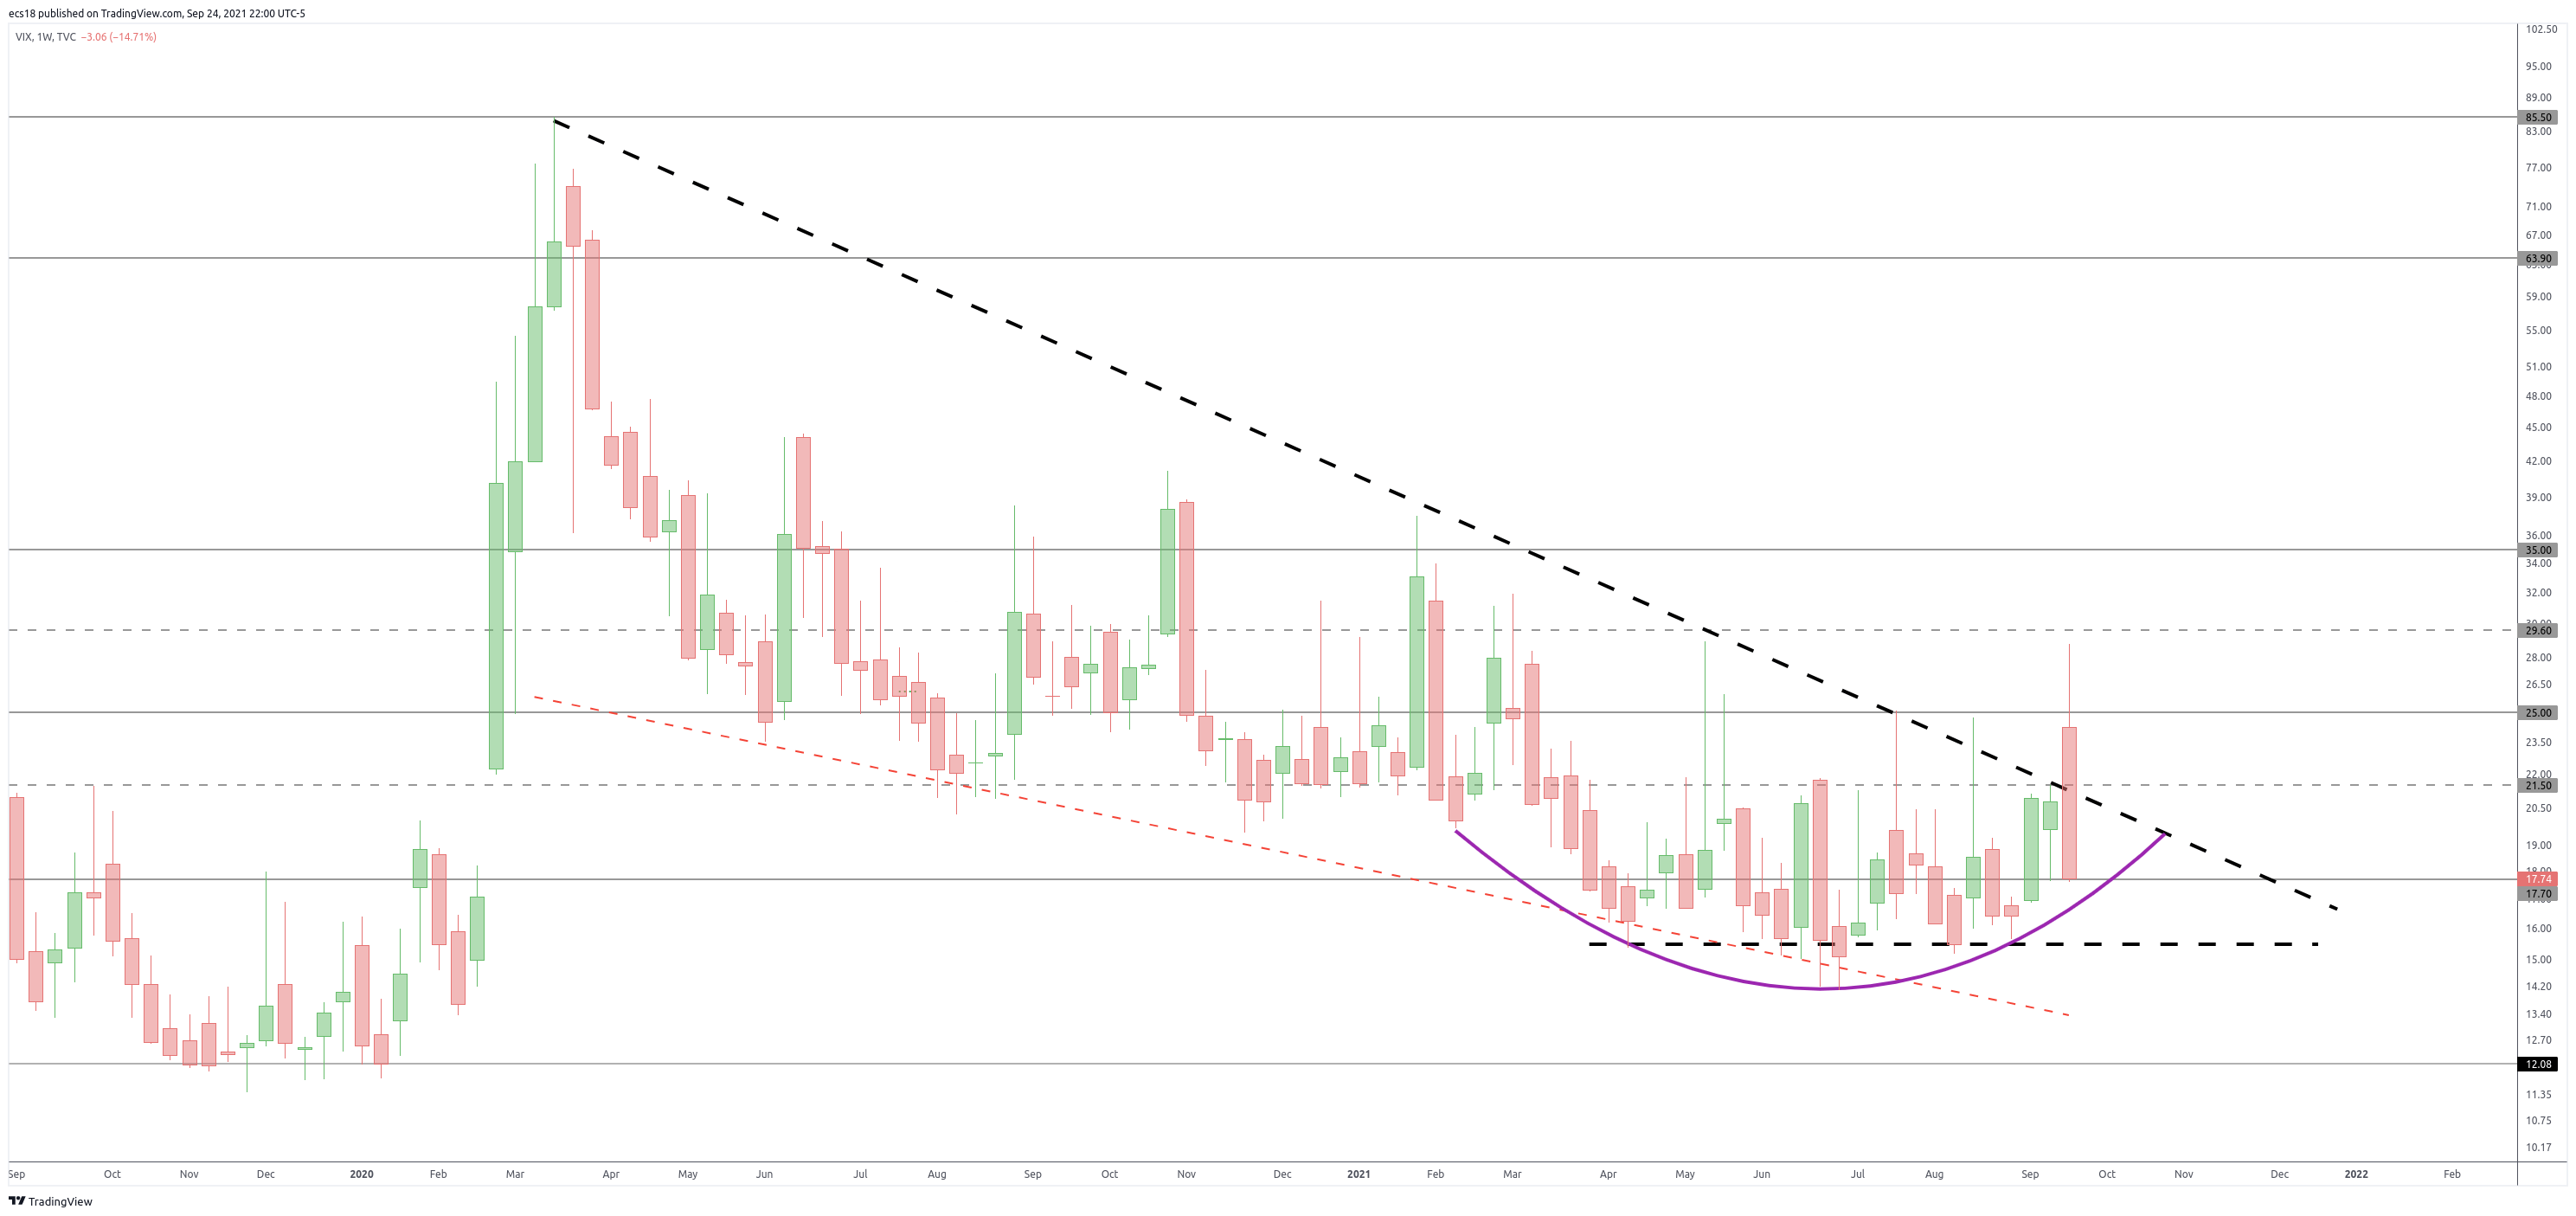
VIX on the weekly should be watched closely. The breakout attempt of last Mon/Tue got invalidated. One week ago we wrote this
We can see how VIX is about to test an important trendline. A move above this trendline would open the door for more selling in the S&P 500.
VIX went in overdrive but only for two days. Luckily. As seen on below chart the ‘breakout attempt’ invalidated intra-week, and VIX fell back down.
What we can see on the weekly chart, however, is a long rounded reversal (purple line) that is pretty clear and clean. This rounded reversal is bullish VIX, so bearish SPX, until it is broken.

We should take this setup seriously. As long as VIX does not fall below the purple reversal line there is still elevated risk levels ‘in the air’, volatility can suddenly pick up. The opposite is true as well: VIX below 17 points would invalidate the reversal setup, and would turn the S&P 500 really bullish.


