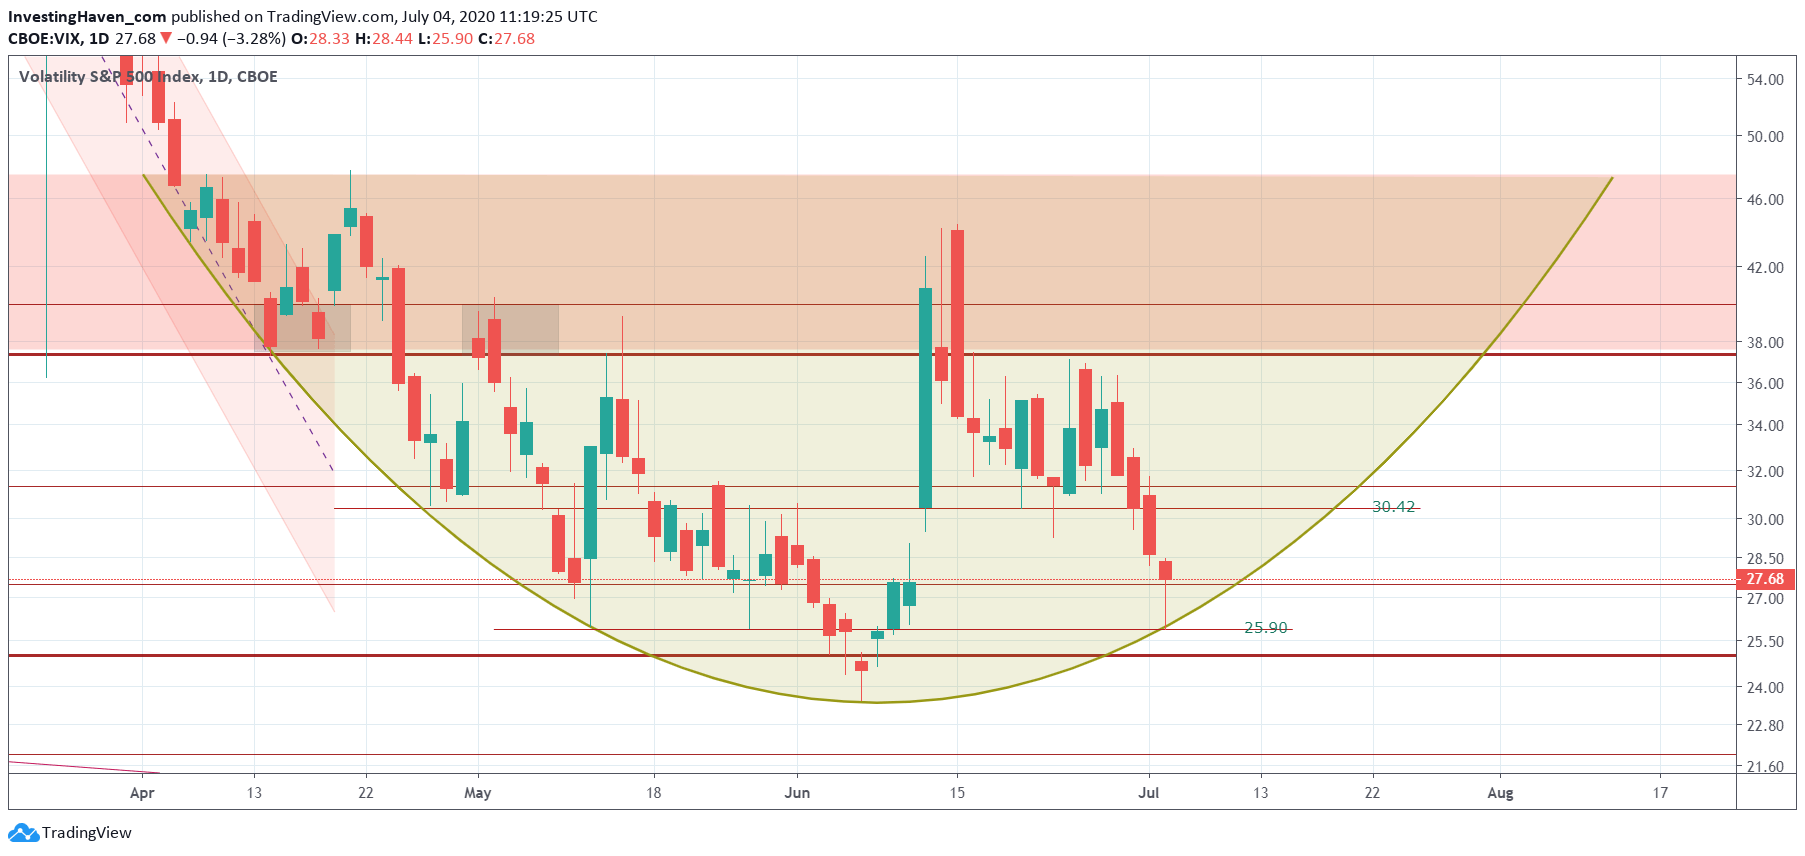
We see a high probability scenario in which July of 2020 will bring a sudden sell off in broad markets. That’s what our VIX crash indicator is telling us. Consider this our most important short term forecast, which is valid until the bearish setup invalidates.
We mostly keep the materials for our premium members separate from our writings in the public domain. However, today we’ll feature one chart that comes from our premium research materials.
Embedded in this article is our VIX crash indicator chart.
Guess what, it shows that a potentially violent reversal pattern is in play. Moreover, it shows that IF a sudden spike in volatility may come up it will happen in July of 2020.
That’s exactly 20 trading days left in this potentially very nasty setup.
This forecast invalidates once VIX goes below 25 points.
But with the biggest sell off in history of markets just 4 months behind us we can expect some aftershock(s).
Last week we wrote this in our article Fear In Markets On The Rise … Again!
Fear in financial markets is on the rise. Our risk indicator suggests the new cycle which is about to start tomorrow might be characterized by ‘risk off’ as opposed to the ‘risk on’ cycle we saw in April and May of 2020.
Our fear indicator as well as volatility/crash indicator may be confirming each other. This is not a time to outsmart markets, but to be very vigilant to observe these small (bearish as well as bullish) signals that make a world of a difference!


