It is breakout or breakdown time in the uranium mining space. InvestingHaven’s research team has collected 3 amazing uranium mining stock charts for 2017 which will make most investors go hmm.
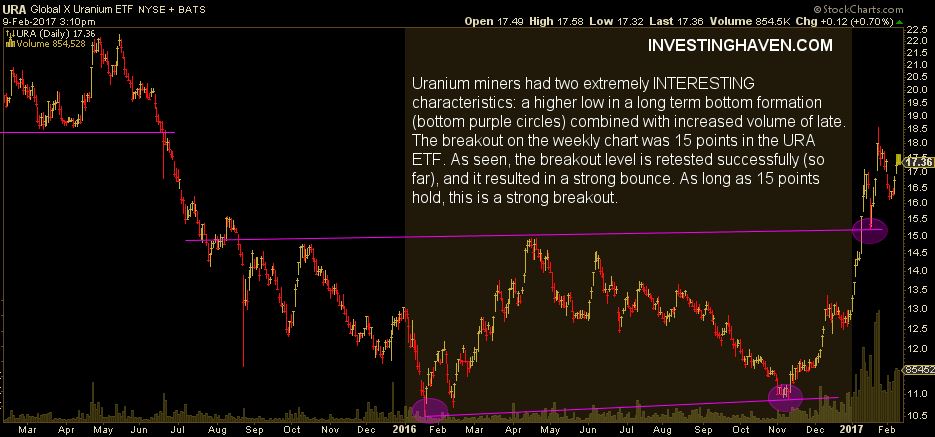
First, the uranium stock mining ETF URA is about to challenge it recent high at 19 point. Note how that high was exactly the support level of two years ago (March ’15). That is certainly no coincidence, as former support always becomes resistance, and vice versa.
The annotation on the URA chart below is exactly the same as the one we published 3 weeks ago in this uranium mining stock chart analysis. Note how the 15 point level has held amazingly well so far. URA is going higher right now on increasing volume. That is very bullish. A break above 19 points would be strongly bullish.
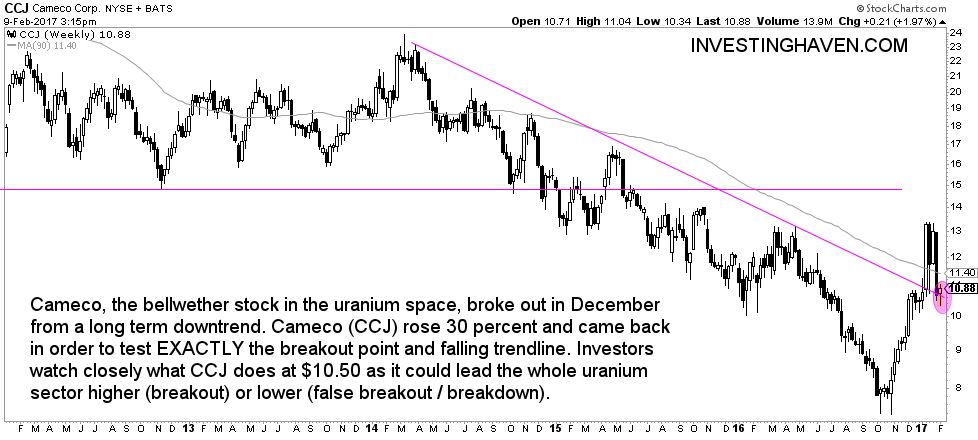
Second, the bellwether stock in the uranium mining space is Cameco Corp, symbol CCJ. It broke out in December, came back to test exactly its breakout point. That is also no coincidence, as breakouts always tend to be followed by a retest of the breakout point. If the market now buys the stock at the breakout point, it confirms the start of a bull market.
The chart of uranium mining stock CCJ is truly spectacular.
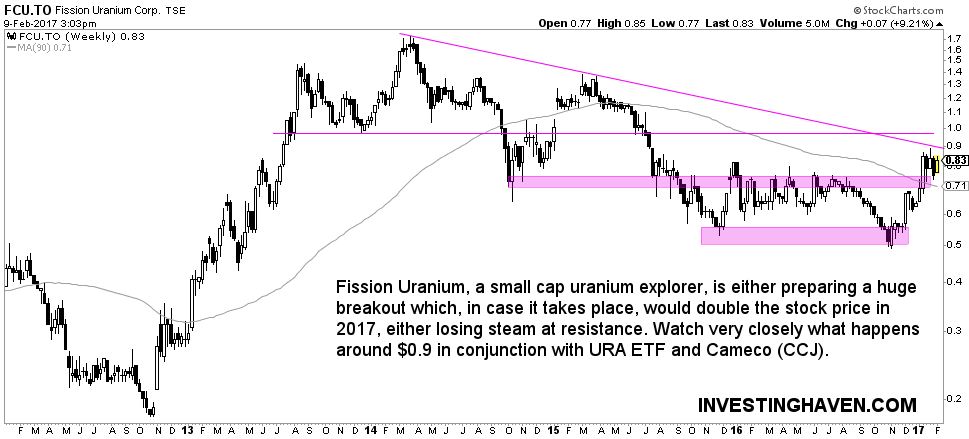
Last but not least, Fission Uranium Corp, symbol FCU.TO, is attempting to break out from a bear market trend. InvestingHaven’s research team observed an important event in Fission’s chart recently, as detailed in A Look At Junior Uranium Mining Stock Uranium Fission. This is now attempt number 3 for Fission to break out.
If this junior uranium mining stock breaks out it would be very meaningful. We would expect to see the stock double in value in 2017. First things first, however, and a sustained break above $0.90 is what investors are looking for.


