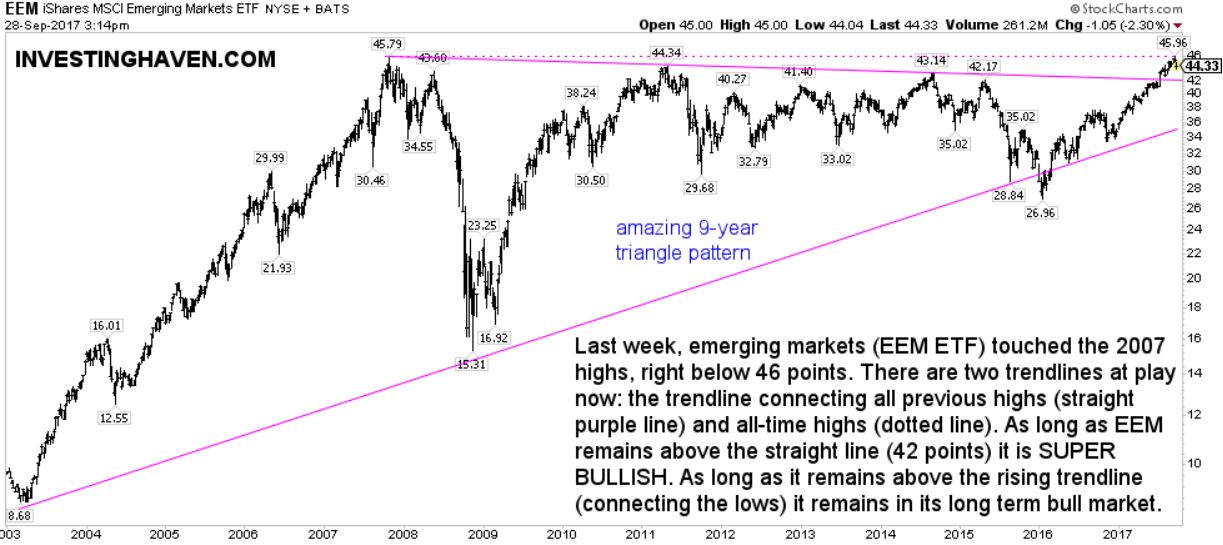
Emerging markets are in great shape in 2017, we have probably covered this topic too many times. But it appears that one question remains still unanswered: for 2017 and 2018 when will emerging markets become super bullish, when will they turn bearish and when are they neutral. To answer that question we look at the key price levels investors should watch.
As said many times before only a handful of price points are important on any chart. It is mostly less than 10 percent of price points that are relevant to monitor.
We wrote earlier this year that Emerging Markets Testing Mega-Breakout, About To Start Strong Bull Market. That was when the emerging markets ETF EEM was near 42 points which coincides with the purple straight line on below chart. That is a breakout level, and EEM got passed it. It is one of those extremely important price points to watch, as long as EEM remains above 42 points it is strongly bullish.
Needless to say EEM ETF should be your guide for emerging stock markets.
Another important price point is 45.9 points. It marks all-time highs in the emerging markets ETF. That price point got hit in 2007, and got tested two weeks ago. Once EEM goes above that price it is hugely bullish.
There is a rising trendline (purple straight line) which connects the troughs of 2003, 2008/2009 and 2015/2016. As long as EEM remains above 36 points it is in a long term bull market.
In other words, once below 36 points emerging markets are bearish.
So there you have the answer(s) to which price points to watch for emerging markets in 2017 and 2018:
- above 45.90 points is super bullish
- between 42 and 45.90 points is very bullish
- between 36 and 42 points is long term bullish
- below 36 points is bearish
The chart makes those points clear.
![[:en]emerging stock markets[:nl]groeimarkten[:]](https://investinghaven.com/wp-content/uploads/2017/05/emerging_stock_markets-1024x682.jpg)


