Markets have gone wild lately as explained in this recent article. We also observed how irregular (irrational?) today’s situation is given all-time highs in both stocks and bonds.
In this article, we show some more extreme readings in the U.S. stock market. We basically do not care whether these extreme readings are driven by a Brexit or anything else, we simply try to understand what this means to investors, and how they have to react/adapt. Our belief is that these extreme readings are a perfect setup for aggressive moves, up or down. In other words, as soon as anxiety in the market calms down, we will see a huge short squeeze in stocks. Alternatively, this setup can also result in some sort of flash crash, similar to August 24th 2015.
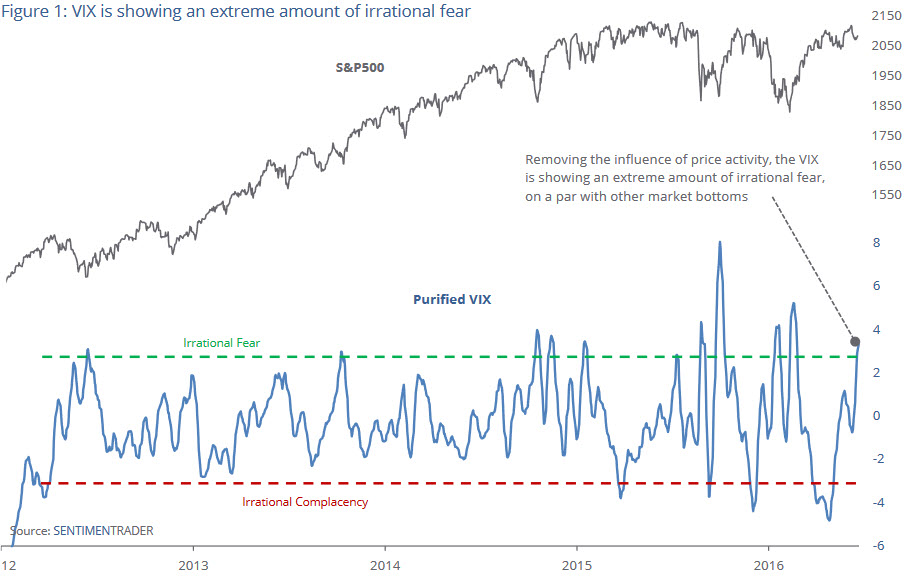
STOCK MARKET CHART 1. Irrational fear has exploded
Traders are showing an extreme amount of irrational fear. “Irrational” is a matter of opinion, but for these purposes we’re looking at the Purified VIX indicator, which minimizes the influence of price activity in order to isolate the emotion behind the indicator. Over the past week, it has spiked to a level coincided with market bottoms over the past several years.
Clearly, investors are concerned about the Brexit vote this week and perhaps even the U.S. election, among others. It seems to have reached a point of extreme already, and that tends to be a medium-term positive for stocks.
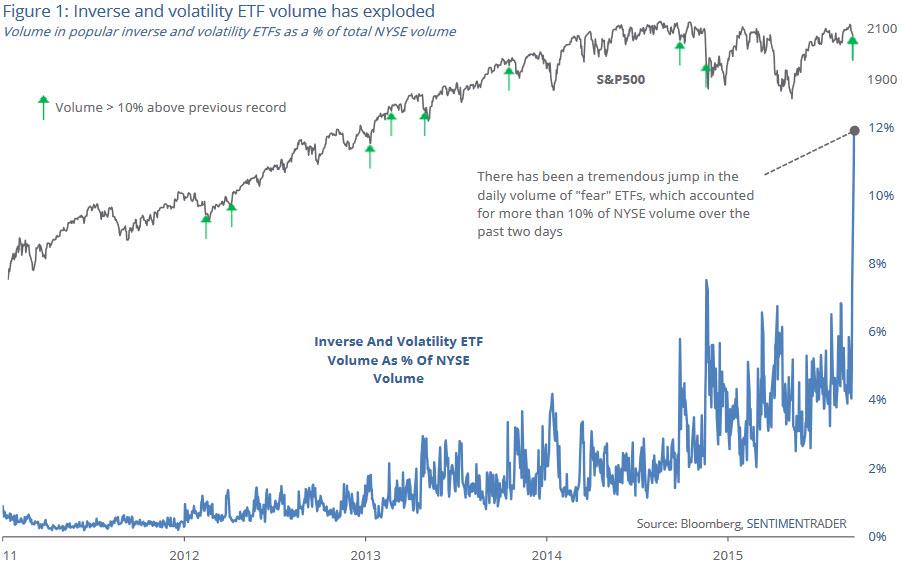
STOCK MARKET CHART 2. Inverse ETF’s have spiked
Traders have embraced funds that profit on fear and uncertainty. Volume in popular exchange-traded products that bet on lower stocks or higher volatility has spiked to a near-record over the past two days (only exceeded by last August). These fear-based funds have eclipsed 10% of total NYSE volume for the first time, and record volume typically leading to a rebound in stocks.
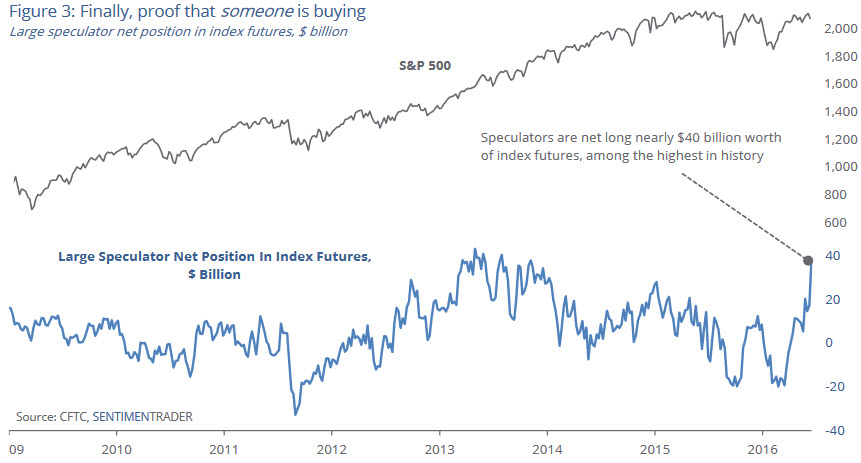
STOCK MARKET CHART 3. Large speculators are betting big on stocks
Speculators, large and small, tend to move in the same way, since most of them are trend-followers. Hedgers take the other side of the trades. Over the past couple of weeks, we’re seeing something we haven’t seen before, though – small speculators are holding a large short position, while large speculators are quickly taking on new long positions. This week their total holdings of major index futures neared $40 billion, the 2nd-highest amount in history.
The only times they exceeded this large of a bet on stocks were in 2013, in late April, mid-July and mid-November. Stocks struggled a little bit after those dates but quickly recovered, and this was not an effective indicator of a sentiment extreme (to be fair, a LOT of sentiment indicators failed from 2012-2014). On the other hand, their extreme short positions in August of last year and again earlier this year were good indications that pessimism had reached an extreme.
Chart courtesy: Sentimentrader.


