The stock market correction of 2017 is underway. We identified several market correction signals in this article but did not look at stock market internals so far. After analyzing market internals it is clear that this is another indicator that suggests the stock market correction of 2017 is now underway.
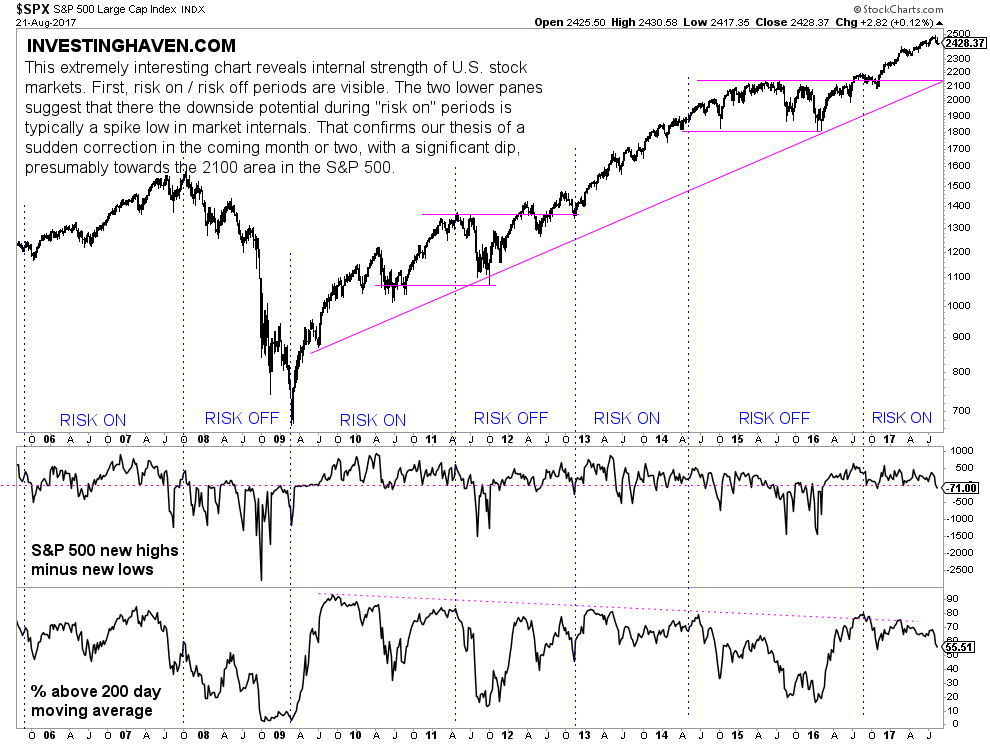
The chart in this article has three parts.
First, the S&P 500 price chart which we also featured in our S&P 500 price forecast for October 2017 suggests that strong support sits at 2125 points. Will the S&P 500 correct, for sure, to that level? Well, nothing is sure in life, and certainly not in markets. But all our indicators suggest a stiff correction is underway, so the most obvious price target is the strongest support within a market correction (between 10 and 20 percent). That is how we derive that price target.
Stock market internals suggest stock market correction of 2017 started
The second pane of below chart is one of our favorite stock market internals. It is the number of stocks that trade at new highs minus the number of stocks trading at new lows. As seen, that number is now in negative territory, the first time it happens in the last 12 months.
According to the risk on / risk off cycles it is clear that the corrections during “risk on” periods is contained. Mostly, these corrections are short but intense. We expect a sudden but stiff correction, which will last a couple of weeks. It will create a spike low in this first market internals indicator.
The third pane shows the % stocks in the S&P 500 that trade below their 200 day moving average. It is also a market internal indicator, and one we like as well. That indicator is weakening as well. Though it is certainly not a timing indicator whatsoever it certainly confirms the view of all other indicators we have looked at so far.
As said we before, we do not expect a stock market crash. We rather believe that a stiff stock market correction is coming. Although we are not into Elliott Wave cycles it appears that Elliott Wave analysis has the same conclusion.


