The gold market is acting strongly in recent weeks. That bodes well for gold bulls. Both for gold bulls and bears we have 3 must -see gold charts in this article. It highlights the continuing story of the gold market: bullish energy overshadowed by rude bearish influences. Will bulls or bearsh win? Very hard to say, very hard to read the gold market says InvestingHaven’s research team. So time will tell, and the important price points, as always, need full attention of investors.
Below 3 gold charts are courtesy of Stockcharts.com.
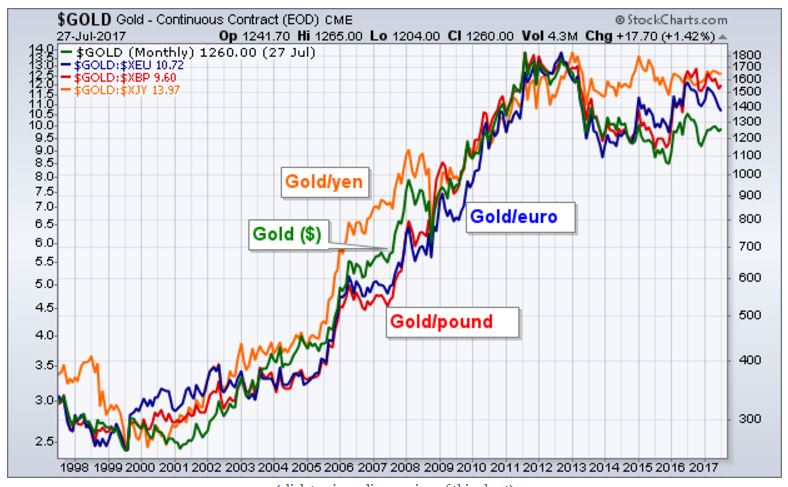
The first gold chart: long term in 4 leading currencies
For a gold rally to be sustained, it has to do more than rally in dollar terms. It has to rally against foreign currencies as well. The last major rally in gold took place from 2002 to 2012. The first chart shows that gold rallied in dollar terms (green line), in euros (blue line), British pounds (red line), the yen (orange line) and the Canadian Dollar (not shown). That’s not the case right now.
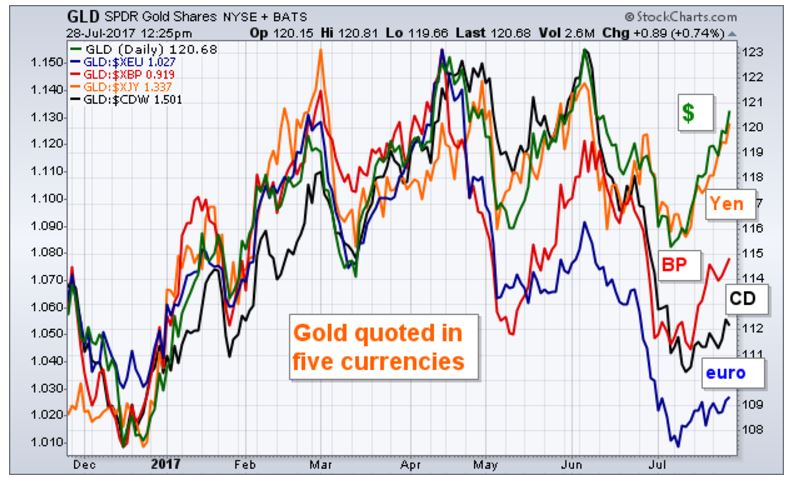
The second gold chart: the 2017 trend in 5 major currencies
The 2017 gold trends in 5 major currencies lines paint very different pictures. Gold is doing best this year against the dollar (10%) and yen (4%) because they’re two of the year’s weakest currencies. Gold, however, is weaker against the British pound (3.5%) and the Canadian Dollar (1.8%). It’s actually lost ground against the euro (-1.4%). If you view gold as a hedge against inflation, the lines on the chart show the impact that currencies have on its direction. And how stronger currencies are holding it back, especially in the eurozone. The main point of this chart, however, is to show that gold isn’t exactly rising when looked at in foreign currency terms. That diminishes its bullish potential.
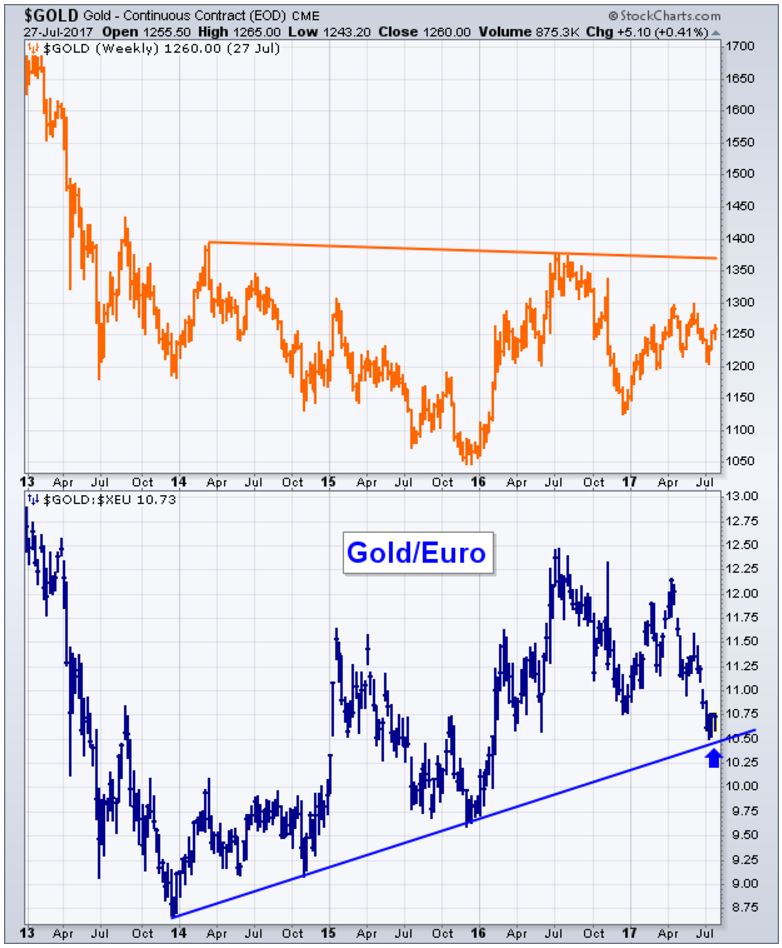
The third gold chart: dollar gold vs euro gold
The third gold chart suggest that gold may be forming a major bottom. It still, however, has a long way to go to clear the trendline drawn over its 2014/2016 highs. Gold usually needs a more inflationary environment to thrive. It usually also does better when stocks are in decline which isn’t the case right now. [Next year, however, may be a different story]. But gold also has to start doing better versus the euro. The blue bars in the lower box show gold trading lower against the euro this year. Its proximity to the rising three-year trendline, however, suggest that gold may start finding support against that currency.


