We have said repeatedly that emerging markets (EEM) are very attractive. Since early last year we have put emerging markets on the top of our list with favorites. India, South Korea, Taiwan, they all outperformed since then, as forecasted. But are emerging markets still a buy, given that they are trading a major breakout which also means it is major resistance?
To answer that question we look at two specific aspects of emerging markets: their Price/Earnings valuation ratio as well charts of individual countries.
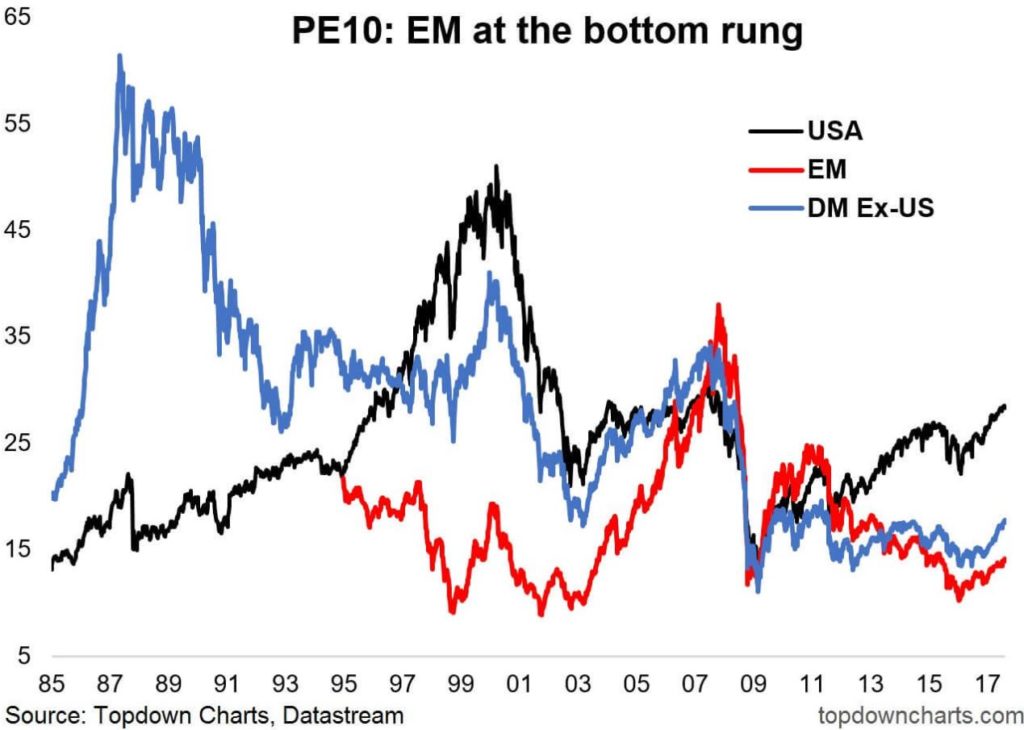
First, the key valuation metric Price/Earnings looks amazing. According to Topdowncharts.com the group of emerging markets is undervalued, and strongly undervalued when compared to the U.S.
Interestingly, developed markets (DM) ex-U.S. follow a similar valuation path in the last 3 to 4 years. So it is one trend: U.S. rising to 2008 levels while developed markets ex-U.S. and emerging markets underperforming strongly.
Source: Topdowncharts.com
Note that valuation ratios should not be considered timing indicators. In other words, it is not clear when and how an undervalued market will play catch up.
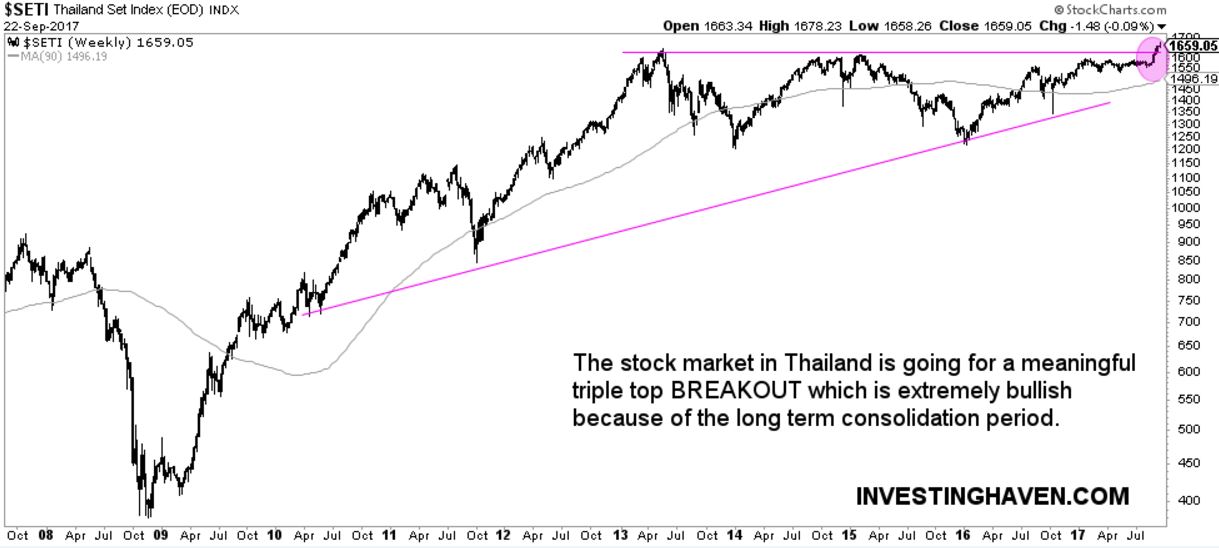
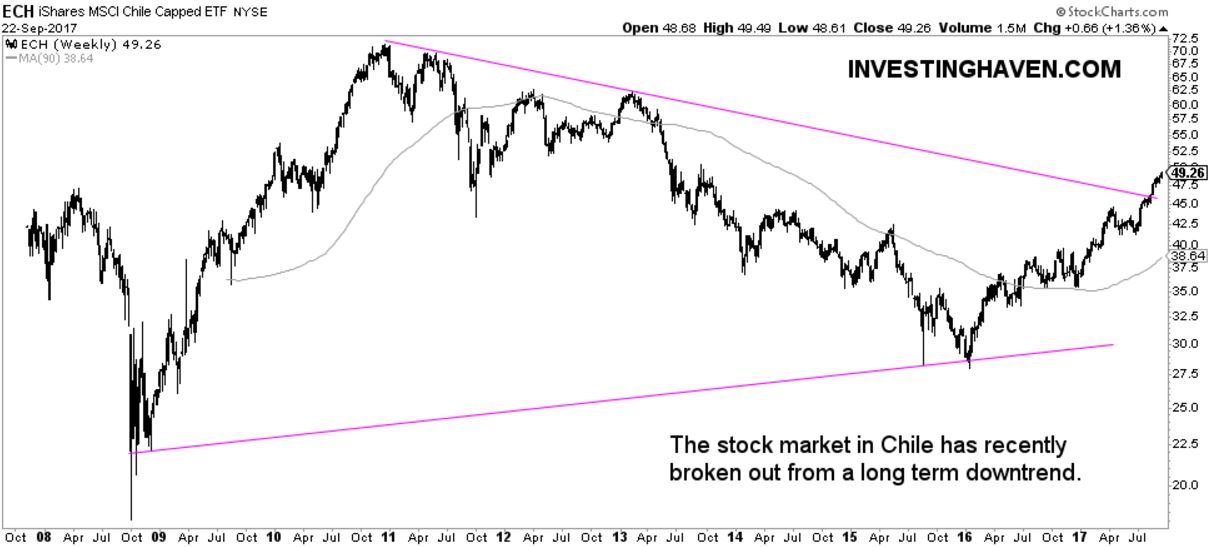
When it comes to that second point we mentioned before, individual country charts, it is amazing to see the setup of some of them. We picked out Thailand and Chile.
Thailand is consolidating for 4 years and set recently a triple top breakout.
The chart of Chili is even more impressing. The country recently broke out of a 7-year falling trend. This is a stunning setup.


