Investing
Haven
No Result
View All Result
Tuesday, January 19, 2021
  • Login
  • Premium Services & Login
  • 2021 Forecasts
  • Commodities & Gold
  • Stocks
  • Crypto
  • Mission 2026
Crypto investing >>
Investing
Haven
  • Premium Services & Login
  • 2021 Forecasts
  • Commodities & Gold
  • Stocks
  • Crypto
  • Mission 2026
No Result
View All Result
Investing Haven
No Result
View All Result
Home Trendwatching

India Stock Market Outlook For 2017

by Taki Tsaklanos
December 26, 2016
in Trendwatching
0
Tags: 2017 ForecastsINDA
2.1k
VIEWS
Share on FacebookShare on Twitter

The stock market of India was a top performer throughout 2016. But what’s the India stock market outlook for 2017?

As usual, we start with a short overview of sentiment. In general, the Indian stock market outlook does not get a lot of attention, which is a typical bullish phenomenon. As said before, bull markets which go unnoticed have the most potential.

This analyst recently wrote that the Indian stock market outlook for 2017 is bearish. That is very strange to us, as the price levels mentioned by the analyst, e.g. 8600 points in the Nifty 50 Index, the key stock market index in India, do not seem to carry much value on our charts. We find important price levels at 8100 points and 7500 points, based on our chart analysis visualized below.

India stock market outlook still bullish for 2017

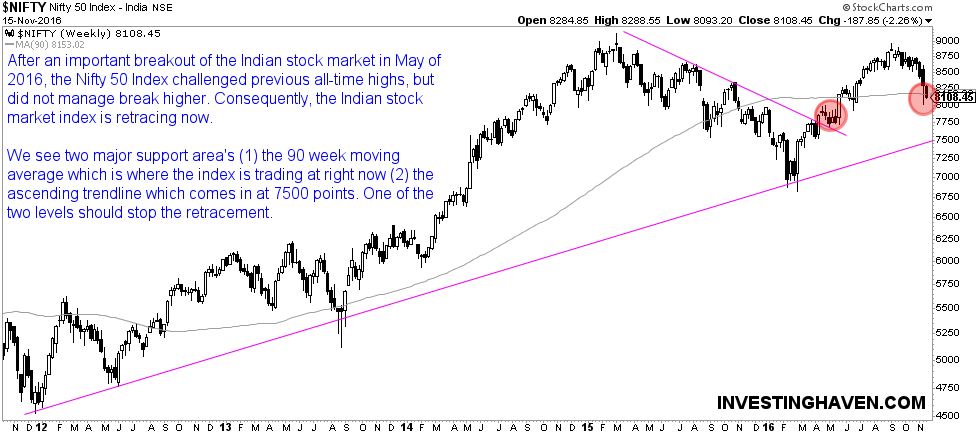
Basic chart reading of the Indian stock market reveals a long term pattern with very strong support at 7500 points. Worst case, the index will fall to that level, which still validates a bull market scenario. The other important price level is 8100 because that is the 90 week moving average (the only technical indicator which we monitor). As seen on the chart, that moving average has mostly acted as support or resistance in the last 5 years.

Although we do not focus too much on retracement levels, we see that the 50% retracement of the 2016 bull run coincides with 8000 points. We consider this more of secondary importance though, but it clearly shows how important the current 8000 to 8100 level is.

Our outlook for the stock market in India in 2017 is that it will start the year in a bearish way. We expect a quick turnaround into a bull market. The line in the sand is 7500 points, and we expect this level to hold. If not, for whatever reason, then market conditions would become concerning.

India stock market outlook 2017

Update on our Indian stock market outlook

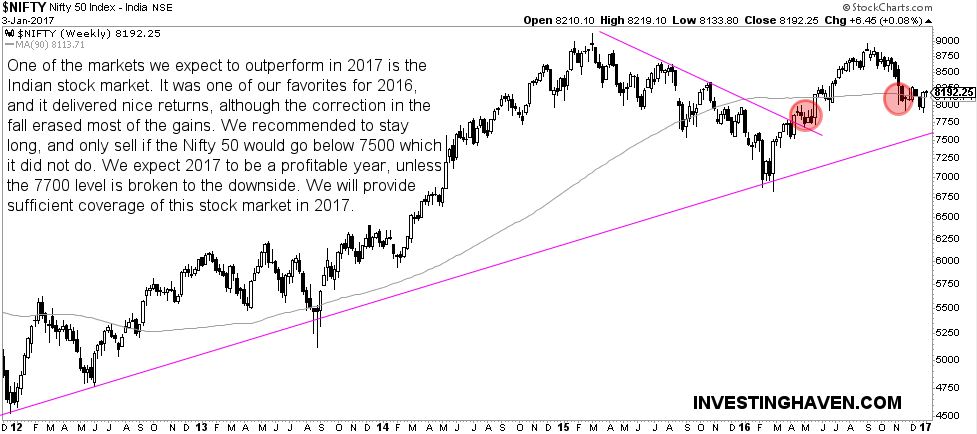
The Indian stock market currently trades at 8200 points. The first weeks of 2017 will be very important for India and its stock market, as its chart setup looks great at this point. After a correction in the fall of last year, the decline came to a halt lately. If the index goes higher from here, it would be extremely bullish as we would have a higher low, more than 5 pct above secular support (purple rising line on the chart). In other words, the rising trend would be validated, and it would, without any doubt, lead to a new attempt to break through all-time highs.

If the rising trend line will not break (read: the 7700 level is broken to the downside), we expect 2017 to be a very profitable year for global investors that are long the Indian stock market.

This is a much more constructive setup than the one above, which we took at at the end of sharp retracement.

india stock market

  premium service trade alerts   premium service trade alerts   premium service crypto teaser  
Taki Tsaklanos

Taki Tsaklanos

Taki has +15 years of experience in global markets. His methodology is unique and effective, yet easy to understand; it is based on chart analysis combined with intermarket / fundamental / sentiment analysis. His work appeared on major financial outlets like FinancialSense, MarketWatch, ... Email: taki.tsaklanos@gmail.com. Twitter: twitter.com/investinghaven

  • Trending
  • Comments
  • Latest
silver prices

A Silver Price Forecast For 2021 *Silver 30 USD Underway*

January 2, 2021
gold price

A Gold Price Forecast For 2021 *Gold 2200 USD Underway*

January 2, 2021
dow jones

Dow Jones Long Term Chart on 20 Years *10 Must See Charts*

October 26, 2020
dow jones

A Dow Jones Forecast For 2021 *New All Time Highs*

January 2, 2021
bulls bears

S&P 500: Is This A Medium Term Topping Pattern?

0

Protected: [Emerging Markets/Gold/Silver] Heads up Template

0

Protected: [SPY] Heads up Template

0

Protected: [GOLD] Buy Alert Template

0
bulls bears

S&P 500: Is This A Medium Term Topping Pattern?

January 17, 2021
bitcoin

Bitcoin: Major Top Already Hit Or Parabolic Move Underway?

January 17, 2021
risk

Global Stock Leading Indicator: A Not So Promising Setup For February of 2021

January 17, 2021
us dollar

Dollar Ready To Create Havoc With Markets?

January 17, 2021

Connect with InvestingHaven

Receive top notch forecasts for free.

*We hate spam as you do.

Categories

  • Premium Services & Login
  • 2021 Forecasts
  • Commodities & Gold
  • Stocks
  • Crypto
  • Mission 2026

Site Navigation

  • RSS Feed
  • About us
  • Sitemap
  • Privacy & Disclaimer
  • Terms of Service
  • Contact Us
Investing
Haven

Top notch forecasting with gold price forecast, many stock predictions, cryptocurrency charts. Many investing tips and crypto market analysis.

Copyright © 2021 Investing Haven

No Result
View All Result
  • Premium Services & Login
  • Premium Investing Service
  • Premium Trading Service
  • Premium Crypto Service
  • 2021 Forecasts
  • Markets & Stocks
  • Commodities & Gold
  • Crypto Markets
  • Mission 2026

Copyright © 2021 Investing Haven

Login to your account below

Forgotten Password?

Fill the forms bellow to register

All fields are required. Log In

Retrieve your password

Please enter your username or email address to reset your password.

Log In