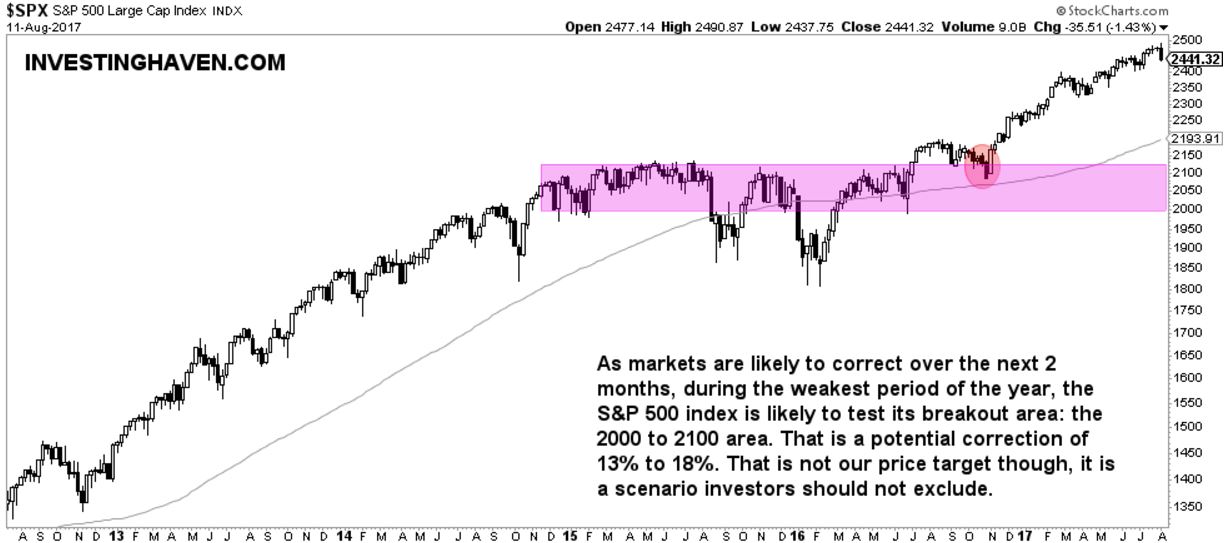
Is this the beginning of a stiff stock market correction? Most likely, yes. This time could be different given the increasing number of worrisome signs we identified recently: a series of volatility warning signs, maximum complacency in stock markets, 3 stock market indicators flashing red. So, with those increasing bearish signals, what is the S&P 500 forecast for late 2017 (SPY)?
First, as usual, we try to get a clue from financial media, and, as asual, we don’t get any valuable piece of information for forecasting purposes. Financial media are great in writing much, but close to nothing is relevant for investors. Part of the reason is their focus on the very near term, think of daily changes.
This CNBC piece projects bearish market conditions, which is in line with what we think, but we have read so many of this type of article in the last 12 months that there is no specific data point in that article we deem relevant. It becomes even worse in this article, also from CNBC, in which the authors makes the point that the 1% decline in the S&P 500 of earlier this week is a rarity in 2017. Who could not figure that out? Last, Marketwatch looks into the intraday charts in order to identify a breakdown event in the S&P 500; here again, this is so near term focused that it does not add too much value other than for short term traders.
Given the articles and data points we wrote about in recent weeks (see three links in the first paragraph) we believe it’s relevant to look for a bearish price target for stocks.
Our most bearish S&P 500 forecast for 2017 (October / November)
Although it is very hard to forecast a specific price target it is mostly recommended to look at the most and least bearish scenario.
From that perspective, the least bearish correction is a mild retracement until the 2325 area, which would mark a higher low against April of this year. That scenario is even not worth discussing as it marks a 4 percent retracement.
However, the next support level lies much lower: the first chart suggests that structural support comes in at the breakout level of last November, just below 2100 points. That price point is part of a longer term consolidation period going back more than a year. The purple bar is the area that provides support: 2000 to 2100 points.
It is fair to say that the most bearish scenario will bring the S&P 500 down towards the 2100 area, it could even dip towards 2000 points.
Are we saying that the S&P 500 * will * go to 2000 points? That is certainly not what we are forecasting. Our point is that the most bearish scenario * could * bring the index down significantly, it could even dip in that larger support range, which would be a correction of 13 to 18 percent. So our most bearish S&P 500 forecast for 2017 (October to November time period) is approximately 2050 points, some 15 percent from today’s levels.
One of the indicators that could forecast how strong the coming correction will be (read: if we will be in the soft vs the strong bearish scenario) is how market leaders will do. In particular, the semiconductor sector has clearly led stocks higher since last November. Semis are testing their rising channel right now. If they go lower from here, we could be looking at a meaningful correction because it would already take place in August, which is right at the start of the weakest time period (a period which typically lasts some two months).


