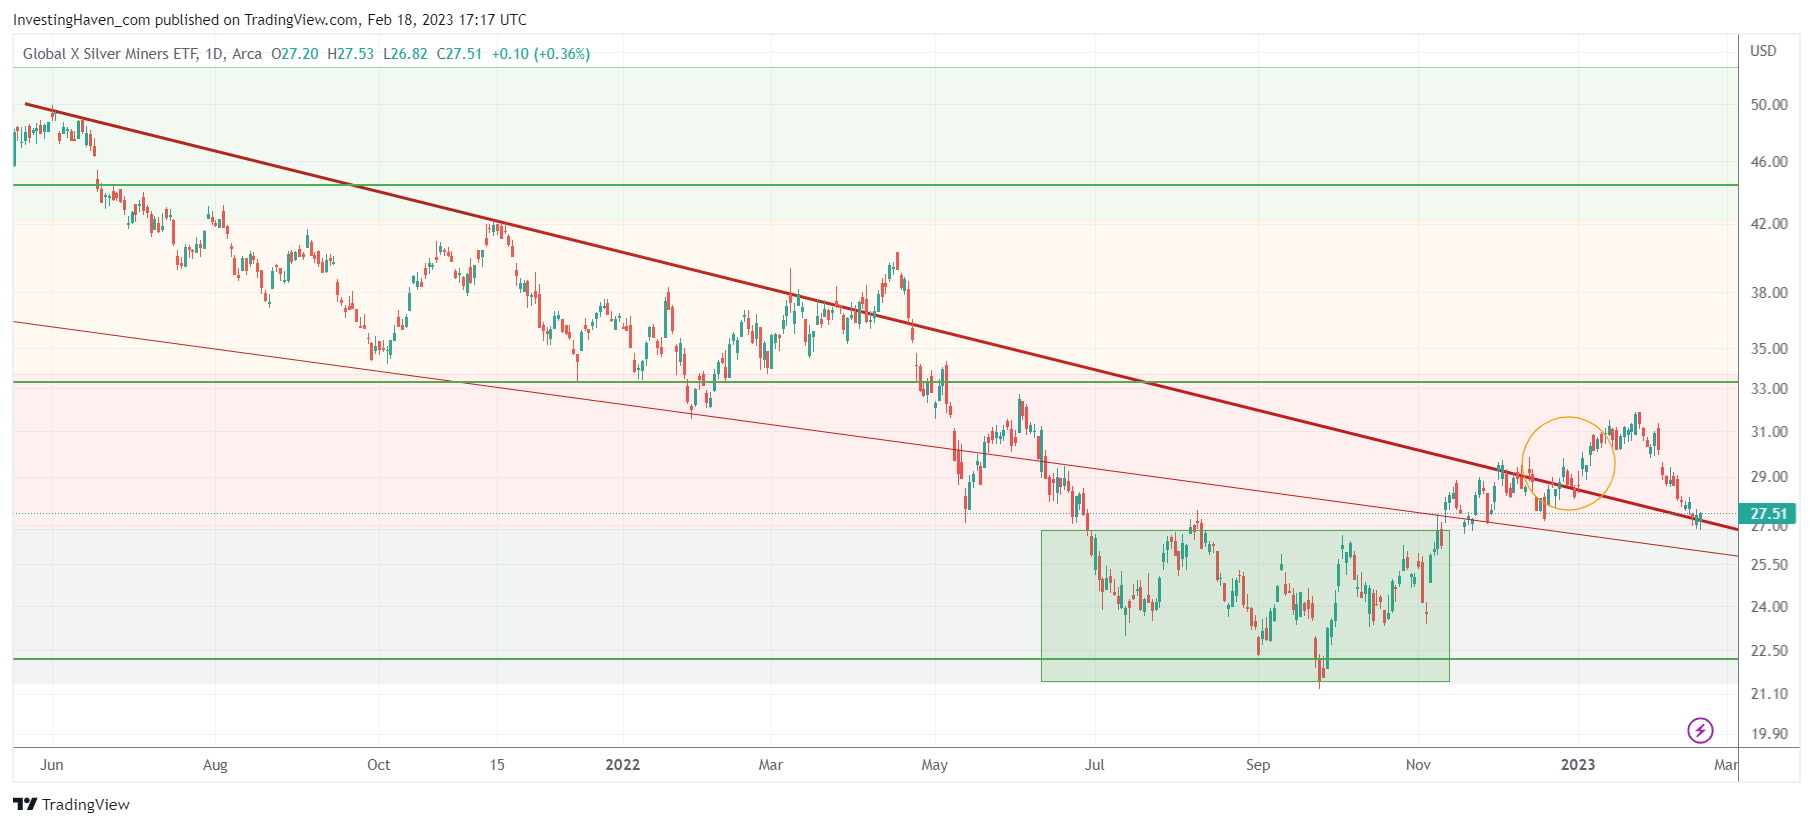
Our short term silver pullback forecast is working exactly as laid out. Bigger picture, we believe that the ongoing silver pullback is part of a wide bullish reversal pattern, one that is consistent with our silver price forecast. We focus on the silver mining chart in this post because we believe that silver junior miners have huge upside potential.
What stands out, looking at the silver mining chart, is the ongoing ‘back-test’ of the bear market trendline that was dominant in 2021 and 2022.
As seen, silver miners registered a bullish reversal in the period mid-June till mid-November of 2022. The ‘breakout’ level of the reversal is approximately 25 points.
SIL ETF now trades at 27.5. In a way, it is close to ‘testing’ the reversal breakout point but also the bear market trendline (which it cleared 6 weeks ago).
There is a lot of support for silver miners in the current area. We want to see strong support around 25.50 points, in the coming weeks, in order to be confident that silver miners are in a BUY area.
Interestingly, but uncoincidentally, gold is also near key support as explained in Gold: Close To Decent Support Levels. It is happening right at a time when SIL ETF is also approaching key support. The price of gold, the price of silver and silver miners are in synch, that’s good and increases confidence in our hunt for a turning point.
For our Momentum Investing members, we created a selection of top silver miners:
Top Silvers Stocks For Long Term Portfolios >>


