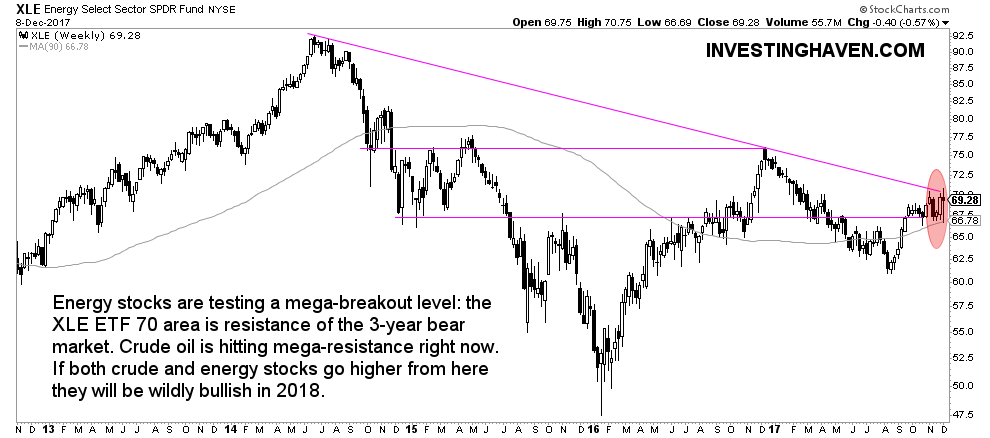
Energy stocks (XLE) are a real roller coaster. They tend to move aggressively in both directions. The extreme sell off two years ago got followed by a strong rally and a significant retracement recently. So what to expect going forward? This is InvestingHaven’s energy stocks outlook for 2018.
Crude oil outlook
First of all, there is of course a very strong correlation between crude oil and energy stocks. That is why we start this energy stocks outlook with a top level analysis of crude.
Last year, InvestingHaven published this Crude Oil Price Forecast for 2017 with this key take-away:
The $35 to $40 range will act as strong support. Prices could certainly move higher, but will find secular resistance at $75 where the 2014 gap down started.
So, overall, investors could go long in 2017 once crude oil prices fall towards the $40 level and close positions (or go short) above $60.
It was a spot-on call. Energy stocks, obviously followed a very similar path.
Our recent outlook has not changed very much compared to the one last year. In our recently published Crude Oil Forecast For 2018 we wrote:
We highly suspect that if price of crude oil will achieve 60-62 USD, later in 2018. That is our crude oil forecast for 2018. If that would materialize it would be major news, so stay tuned and stay focused on the charts!
That said, we believe that crude oil is not very far away from major resistance. Prices can always move higher, our outlook and forecast are not set in stone. So it is crucial to continue monitoring the charts once a price target is met, not only in that specific market but also across markets.
Our energy stocks outlook for 2018
Recently we published an article concluding that Energy Stocks Outlook Not Bullish Yet, It Is Neutral. Though many could be (wildly) bullish, for instance CNBC believes it is time to buy energy stocks and SeekingAlpha sees a breakout opportunity, we prefer to wait for a confirmed signal that it is time to go long. Moreover, both crude oil and energy stocks are bumping into secular resistance. Let us explain.
We recommend not to become too bullish until a breakout is confirmed. We are aware some analysts are already (wildly) bullish. But a bull market only starts once a breakout has materialized. Stated differently, smart investors wait for a breakout to get confirmed before becoming very bullish.
The breakout in energy stocks will only take place once the 70 point level in XLE ETF is broken to the upside. Moreover, after a breakout, there is a high probabily that prices come down to test the breakout point again, which, in the case of energy stocks, is 70 points in XLE.
Admittedly, XLE is very close to a breakout. It is a pressure cooker because, all previous attempts to break out (92 points in summer ’14, 76 points in December ’16) were different than the shape we see today. That in and on its own is not a valid signal, it is of secondary importance. That is how we read the chart and the unfolding pattern.
Very important, in our viewpoint, is that both crude oil and energy stocks are bumping into heavy resistance. If (and that is a big IF) they are able to clear resistance, the energy market will enter a strong bull market.
In sum, our energy stocks outlook for 2018 is truly dependent on what happens between 66 and 70 points in XLE ETF, see the red circle on the chart. If that level does not get broken to the upside we see downside to at least 61 points, if not lower, in which case energy stocks remain in a trendless state.


