Investing Haven
No Result
View All Result
Gold Silver Investing >>
CRYPTO INVESTING >>
  • 2025 Forecasts
    • 10 market predictions
    • Dow Jones forecast
    • S&P 500 forecast 2025
    • Nasdaq prediction 2025
    • Best altcoins to buy
    • Best crypto to buy now
    • Which crypto will explode
    • 15 crypto forecasts 2025
    • Which precious metal to buy
  • Silver
    • Silver prediction 2025 – 2030
    • Will silver exceed $30?
    • When will silver hit $50?
    • Can silver hit $100?
    • Silver shortage
    • 50-year silver chart
    • Silver bullish reversal
    • Silver seasonality charts
    • How to invest in silver
  • Gold
    • Gold prediction 2025 – 2030
    • Will gold set new ATH?
    • Will gold hit $3,000?
    • Can gold hit $10,000?
    • Gold chart 10 years
    • Gold chart 50 years
    • Gold chart 100 years
    • Gold silver ratio
    • Gold seasonality charts
  • Commodities
    • Coffee forecasts
    • Sugar forecasts
    • Nickel forecasts
    • Lithium investing
  • Crypto forecasts
    • BTC prediction 2025 – 2030
    • ETH prediction 2025 – 2030
    • SOL prediction 2025 – 2030
    • XRP prediction 2025 – 2030
    • XLM prediction 2025 – 2030
    • BNB prediction 2025 – 2030
    • ADA prediction 2025 – 2030
    • AVAX prediction 2025 – 2030
    • KAS prediction 2025 – 2030
    • NEAR prediction 2025 – 2030
    • BCH prediction 2025 – 2030
    • LINK prediction 2025 – 2030
    • DOT prediction 2025 – 2030
    • SUI prediction 2025 – 2030
    • ICP prediction 2025 – 2030
    • LTC prediction 2025 – 2026
    • STX prediction 2025 – 2030
    • DOGE prediction 2025 – 2030
    • SHIB prediction 2025 – 2030
    • PEPE prediction 2025 – 2030
    • FLOKI prediction 2025 – 2030
    • WIF prediction 2025 – 2030
    • ONDO prediction 2025 – 2030
  • News
    • Crypto news
    • Commodities
  • Login
Investing Haven
No Result
View All Result

Home » Commodities & Gold » 5 Must See Gold Price Charts As The Second Half Of 2022 Kicks Off

5 Must See Gold Price Charts As The Second Half Of 2022 Kicks Off

Taki Tsaklanos by Taki Tsaklanos
October 7, 2022
in Commodities & Gold
gold forecast
1.9k
VIEWS
Share on FacebookShare on Twitter

A set of gold price charts confirmed the solid start of 2022 as gold went to peak in March of 2022. Since then, the price has been declining and the strong dollar performance has prevented each and every gold price bounce attempt. The rate hike in June of epic proportions (also historic in terms of size) didn’t help gold’s price performance although gold’ is still attempting to bounce back. We covered gold’s performance following the FOMC rate hike in great detail and we’ll build upon the findings from our previous article.

When we dig a little bit deeper, we see that the solid increase in Gold price in Q1 2022 was fueled by demand rather than speculation.

A strong dynamic for Gold in 2022: increased demand for Gold. We also have a strong USD and historical hikes in interest rates. But we still think our Bullish Gold Forecast is likely to materialize. The following 5 Gold price charts Illustrate why.

Before We Cover Gold Price, Let’s Look at The US Dollar

On June the 30th, we provided our readers with a US Dollar update. The weekly close was not available then so before we dive into Gold price today, lets see what the weekly and monthly close for the USD looks like.

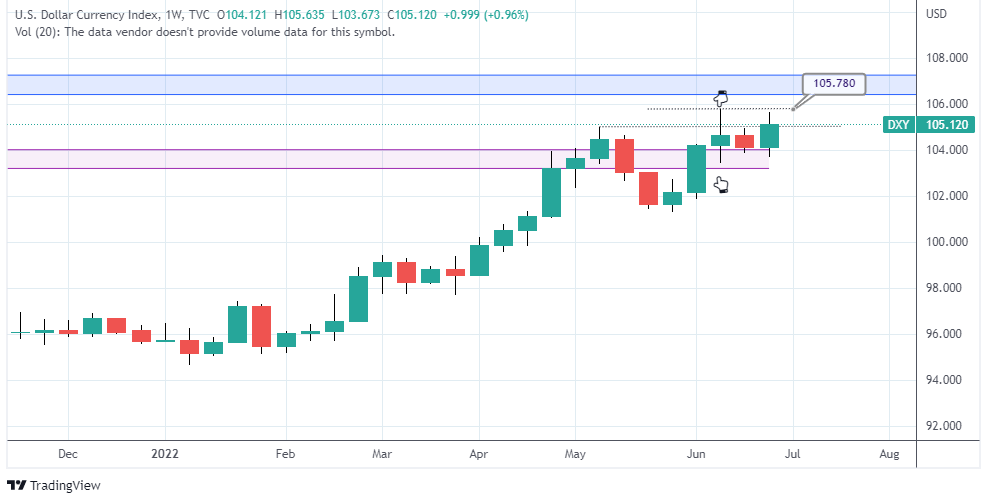
A look at the most recent weekly candles shows the following:

  • $104 ( a previous resistance) acting as a support
  • The week ending on the 17th of June was an important close. It was looking like a top candle and ended up becoming an indecision in the market type of candle. Neither the Bulls or the Bears succeeded that week.
  • However, from that week, we take note of an important level that needs to be broken: 105.78. The high the US price made on June 15th.
  • This last weekly USD close made a higher high in the closing price. The price was never able to reclaim the high from June 15th however.

gold price chart weekly

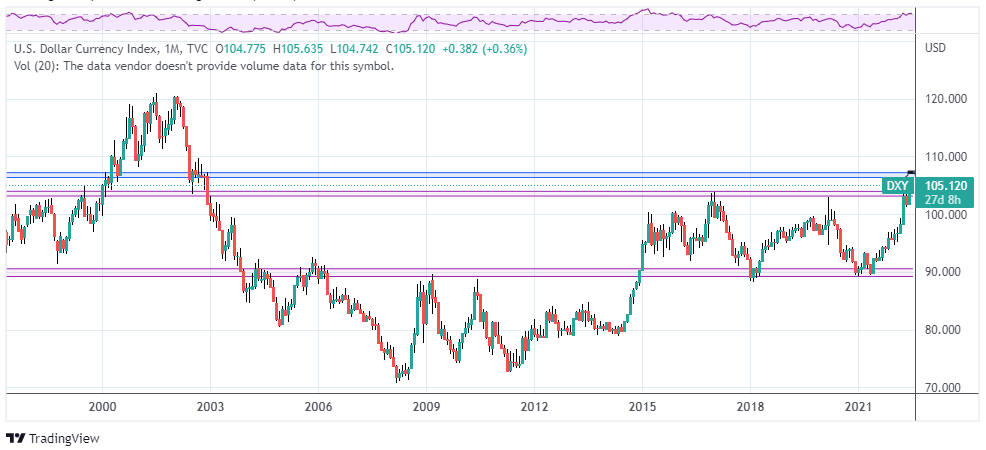
In zooming out we can clearly see how the US dollar is still in a heavy resistance area. Until now, there is no breakout confirmed in the USD, not yet (it might happen or quite the opposite is about to happen).

gold price chart DAILY

5 Gold’s price charts showing its performance in the first half of 2022

The Gold chart below is the most up to date weekly Gold price chart. The price looks like it got rejected and is currently breaking down.

gold price chart monthly

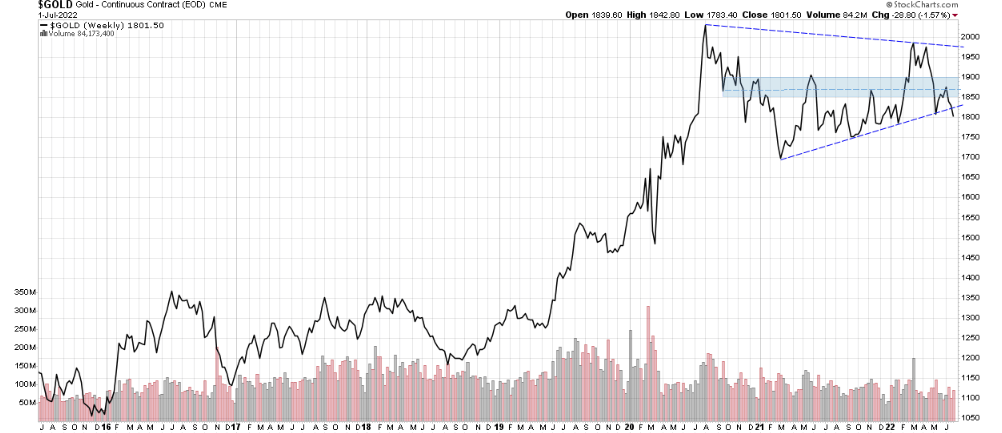
So that’s one bullish setup that is currently being invalidated. We definitely want to keep an eye on this one. However, to really asses the current and potential price direction, we have to look at the big picture. The following Gold price charts should make the big picture clearer.

In fact, that same Gold chart above shows also:

  • A strong multi year uptrend
  • Consecutive higher lows

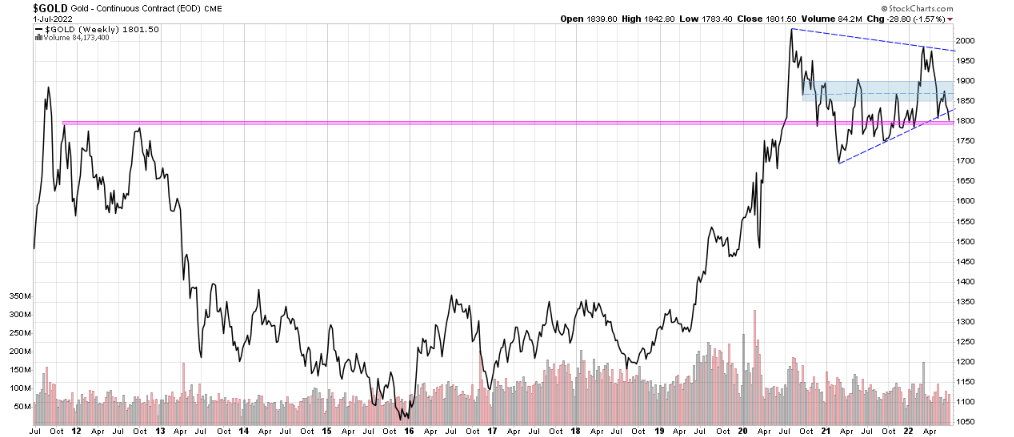
If we zoom out even more, we have a major support area in the $1750 to $1800. See the chart below. Same chart, same weekly timeframe, the only difference is we zoomed out.

In May 2022, we mentioned that “Gold Price Is Still On Track For a Strong Second Half of 2022“. We also highlighted an important support area to keep an eye on:

Why is the $1750 to $1800 area crucial for Gold?

That level was the top from 2012 and if it holds, we have a solid base that can send gold prices higher in the second half of 2022.

That support is exactly where we closed the month of June. So will that support hold or break down? The probabilities favor the support holding here and still valid, and so is the materialization of our Bullish Gold forecast for 2022.

What happens if we zoom into Gold’s price action?

An even closer look at the Gold weekly chart shows a possible double bottom with a higher low. It also shows the multiple support levels hence our assumption that the price is more likely to hold at these levels than break down. Interesting because if you look at the US Dollar price, it is in the exact opposite position: Lots of overhead resistance to overcome. Could the USD still breakout to the upside from there? Absolutely! But based on probabilities and the path of the least resistance, we maintain that the move upwards is about to reverse for the US Dollar.

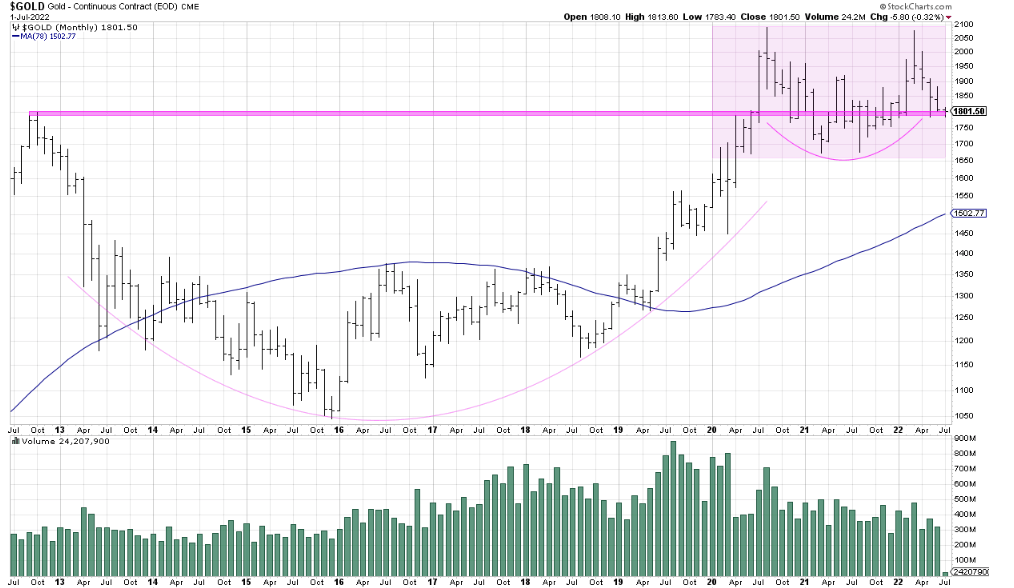
The monthly chart still shows a cup and a handle pattern. Even with a strong US dollar and a historical rate hike by the FOMC, Gold price still managed to close the month of June right at the support level. So far that looks like strength.

Our invalidation level for the Bullish thesis in Gold remains $1700.


Written by hdcharting, reviewed by Taki Tsaklanos


10-YEAR ANNIVERSARY OFFER: InvestingHaven.com celebrates 10 years. Temporarily, you can enjoy a discount on our premium gold/silver and crypto reports. Or you can become a VIP member. Go to our anniversary deals >>
Receive our weekly newsletter.

premium service SP-500 premium service trade alerts premium service crypto teaser 

No related posts.

Tags: GOLD
Taki Tsaklanos

Taki Tsaklanos

Taki has +15 years of experience in global markets. He is passionate about forecasting markets - he calls it THE ART OF FORECASTING. His analysis methodology is unique and effective, yet easy to understand; it is based on chart analysis combined with intermarket / fundamental / sentiment analysis. His work appeared on major financial outlets like FinancialSense, MarketWatch,Twitter: twitter.com/investinghaven

Connect with InvestingHaven

Receive top notch forecasts for free.

*We hate spam as you do.

Site Navigation

  • RSS Feed
  • About us
  • Advertising
  • Sponsored Content Policy
  • Mission 2026
  • Sitemap
  • Privacy & Disclaimer
  • Terms of Service
  • Contact Us
investing haven logo

Precious metals market analysis including gold and silver price predictions. Crypto market analysis including highly accurate BTC ETH SOL XRP forecasts.

Copyright © 2025 InvestingHaven

Login to your account below

Forgotten Password?

Fill the forms bellow to register

All fields are required. Log In

Retrieve your password

Please enter your username or email address to reset your password.

Log In

Receive top notch forecasts for free.

*We hate spam as you do.

No Result
View All Result
  • News
  • 2025 Forecasts
    • 10 market predictions
    • Dow Jones forecast 2025
    • S&P 500 forecast 2025
    • Nasdaq prediction 2025
    • Best crypto to buy now
    • Which crypto will explode
    • Best altcoins to buy
    • 15 crypto forecasts 2025
    • Which precious metal to buy
  • Silver articles
    • Silver prediction 2025 – 2030
    • Will silver exceed $30?
    • When will silver hit $50?
    • Can silver hit $100?
    • Silver shortage
    • 50-year silver chart
    • Silver bullish reversal
    • Silver seasonality charts
    • How to invest in silver
  • Gold
    • Gold prediction 2025 – 2030
    • Will gold set new ATH?
    • Will gold hit $3,000?
    • Can gold hit $10,000?
    • Gold chart 10 years
    • Gold chart 50 years
    • Gold chart 100 years
    • Gold silver ratio
    • Gold seasonality charts
  • Commodities
    • Sugar forecasts
    • Coffee forecasts
    • Nickel forecasts
    • Lithium investing
  • Crypto news
  • Crypto forecasts
    • BTC prediction 2025 – 2030
    • ETH prediction 2025 – 2030
    • SOL prediction 2025 – 2030
    • XRP prediction 2025 – 2030
    • XLM prediction 2025 – 2030
    • BNB prediction 2025 – 2030
    • ADA prediction 2025 – 2030
    • AVAX prediction 2025 – 2030
    • KAS prediction 2025 – 2030
    • NEAR prediction 2025 – 2030
    • BCH prediction 2025 – 2030
    • LINK prediction 2025 – 2030
    • DOT prediction 2025 – 2030
    • SUI prediction 2025 – 2030
    • ICP prediction 2025 – 2030
    • LTC prediction 2025 – 2026
    • STX prediction 2025 – 2030
    • DOGE prediction 2025 – 2030
    • SHIB prediction 2025 – 2030
    • PEPE prediction 2025 – 2030
    • FLOKI prediction 2025 – 2030
    • WIF prediction 2025 – 2030
    • ONDO prediction 2025 – 2030
  • Premium Crypto Alerts
  • Premium services

Copyright © 2025 InvestingHaven