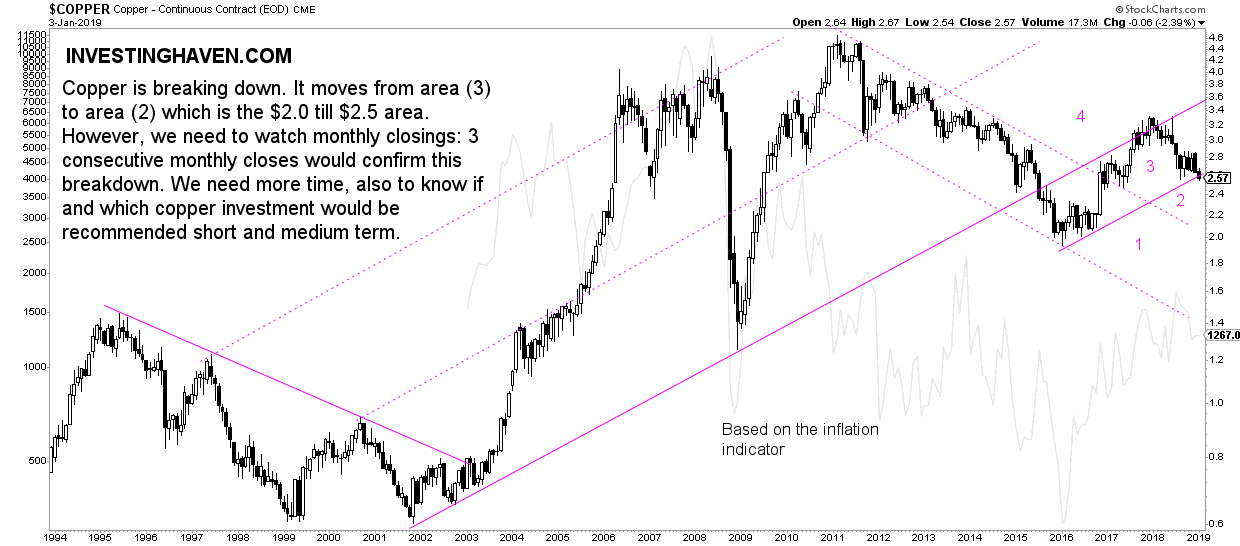
As per our copper price forecast 2019 we consider the Euro a leading indicator for the copper price (COPPER). We also said we suspected a continuation of the rising channel in 2019. In the meantime, we see the start of a breakdown of the copper price as 2019 kicks off. What can we expect from the copper price in 2019?
These price of copper should be read in conjunction with our 15 leading indicators and dominant market trends. We do not consider copper a leading indicator, but more of a follower.
We concluded recently that the copper price is likely going to continue to move in its rising channel, which is indicated with (3) on below chart. We said that “this would be in line with mild inflation and a Euro that would not break down. In such a scenario our copper price forecast for 2019 is in the range of $2.6 to 3.2.”
We added this:
If the Euro breaks down we expect the copper price to fall in area (1) indicated on below chart. Our price target for 2019 would become $2.0 to 2.2.
All this was our forecast from 3 months ago, so it’s about time to update our forecast.
What do we see happening on the copper price chart as 2019 kicks off?
A breakdown, unfortuntately for the copper bulls.
Copper has a great chart with clearly distinguished areas. The price of copper now moves from area (3) to area (2) which is the $2.0 till $2.5 area. It started breaking down from area indicated with the number (3) on below chart. However, this is just the start of a breakdown on a monthly chart, so we have no confirmation yet.
In terms of this breakdown which is, at this point in time, still in progress, we know that a breakdown is a process, not an event. For confirmation that this breakdown is for real, and not a failed breakdown, we need to watch monthly closings: 3 consecutive monthly closes would confirm this breakdown.
Conclusion when it comes to the copper price in 2019: We need more time, also to know if and which copper investment would be recommended short and medium term.


