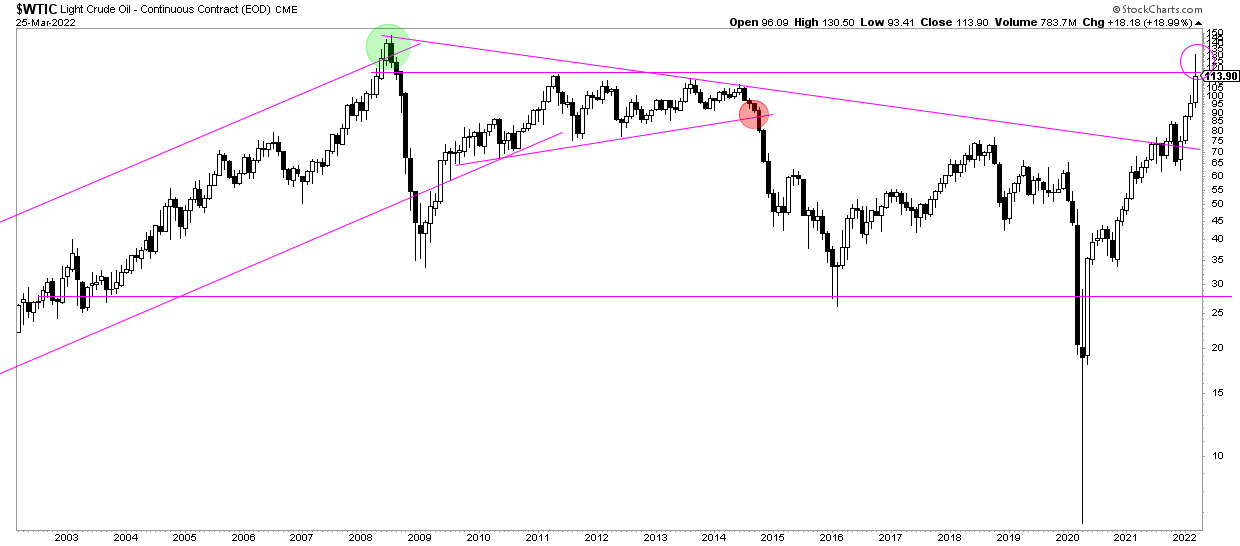
Crude oil investors better pay attention here. Whenever a market prints a ‘wick’ on the longest timeframe, the monthly chart, we know that it may be a serious turning point. A few days before the end of this current month we see a pretty dramatic wick on crude oil’s monthly chart.
We are certainly no experts in the crude oil market. It’s such a heavily manipulated market, and the crude oil chart tends to be so choppy (most of the time) that we are not too focused on the crude oil market.
However, if there is anything that all markets have in common, manipulated or not, choppy or not, volatile or not, it is the turning point characteristics. That’s what we are most interested in.
Here is the rule of thumb: the longer the timeframe, the more important a turning point characteristic will be.
Crude’s monthly chart shown below has a pretty dramatic rejection right below its ATH.
Moreover, and more importantly, this month’s closing price will be pretty crucial. In case crude cannot close above the horizontal line on our chart we believe it will have a really tough time clearing ATH.
What are watching for confirmation of a ‘turning point’?
- Monthly closing prices: Below 116 USD/barrel it is not promising.
- Timing axis: Crude futures went below zero mid-April 2020, we will be looking for confirmation whether crude is completing a 24 month cycle in April of 2022.
While crude oil was an amazing investment in the last 24 months, we believe the upside potential might be limited in the short to medium term. There was much better opportunities out there, is what we are thinking.
We have no exposure whatsoever in the oil and gas market. In our Momentum Investing portfolio we opened positions in undervalued and promising ‘clean energy stocks’, we are also very focused on what we believe is the most undervalued market (silver). Moreover, in our automated trading services in which we trade the S&P 500 for our members we continue to accumulate profitable trades, largely outperforming the vast majority of market participants as well as leading stock indexes.


