Gold: will it win this battle or not? The 3 charts in this article visualize how we look at gold as these represent the 3 leading indicators for the gold market. Note that we have a bullish 2021 price target north of 2,200 USD/oz for the gold price.
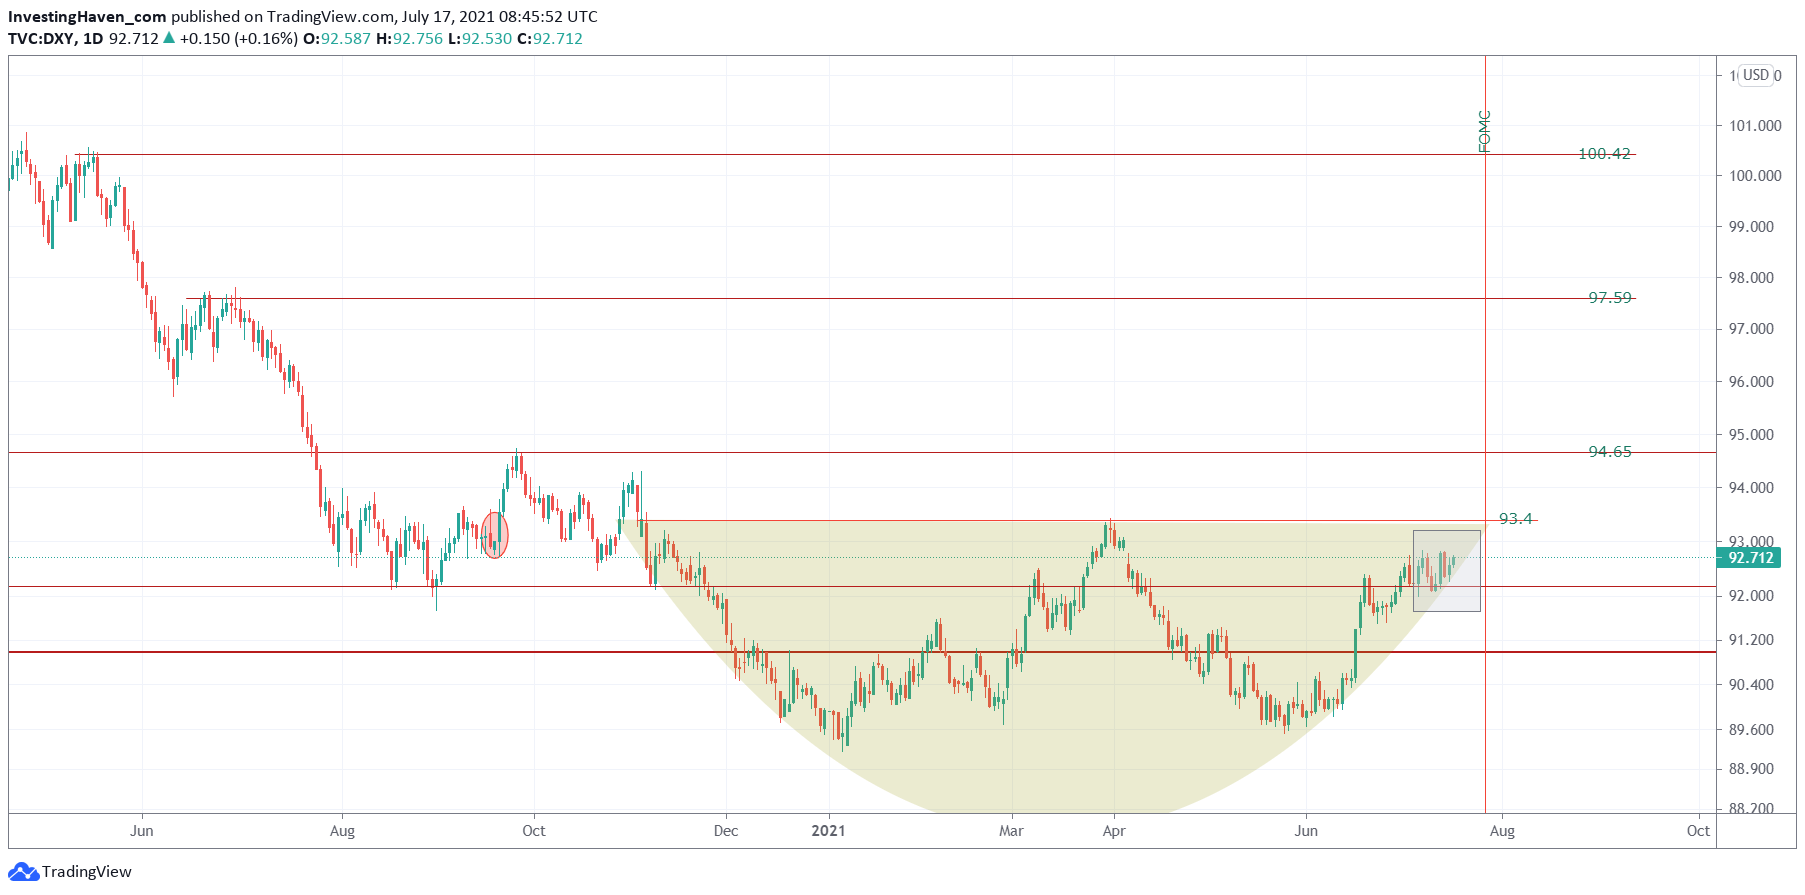
The USD chart has this solid bullish reversal, with major resistance in the 93.4 to 94.6 area.
- The bullish case: the reversal will be so strong that the USD will break through its resistance and move to 97.5 and ultimately 100 points. Not good for gold.
- The bearish case: resistance in the 93.4 to 94.6 area will be proven to be too strong. Good for gold.

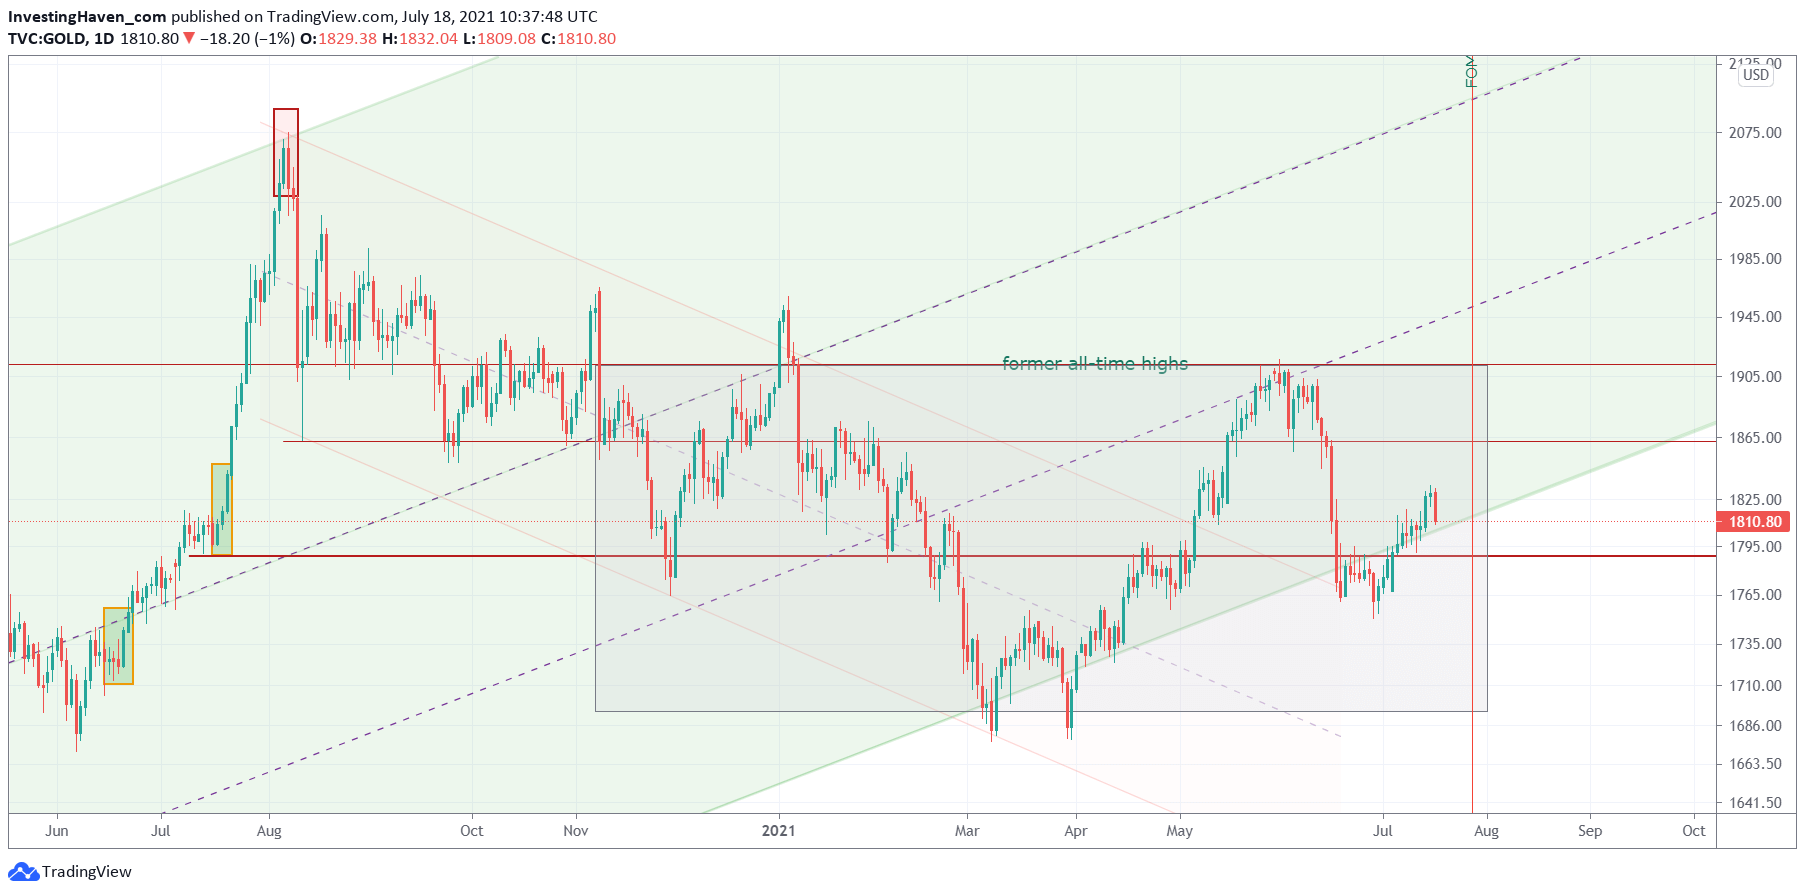
Gold is also a leading indicator of itself. Its price chart is pretty simple to read:
- Bullish case: the big reversal below its former ATH at 1920 USD will be broken to the upside.
- Bearish case: the multi-year channel gives up, and gold cannot hold 1780 USD.
 Does the inverse relationship between the USD and gold explain everything?
If you look carefully you will notice that gold has been rising in periods in which the USD was flat.
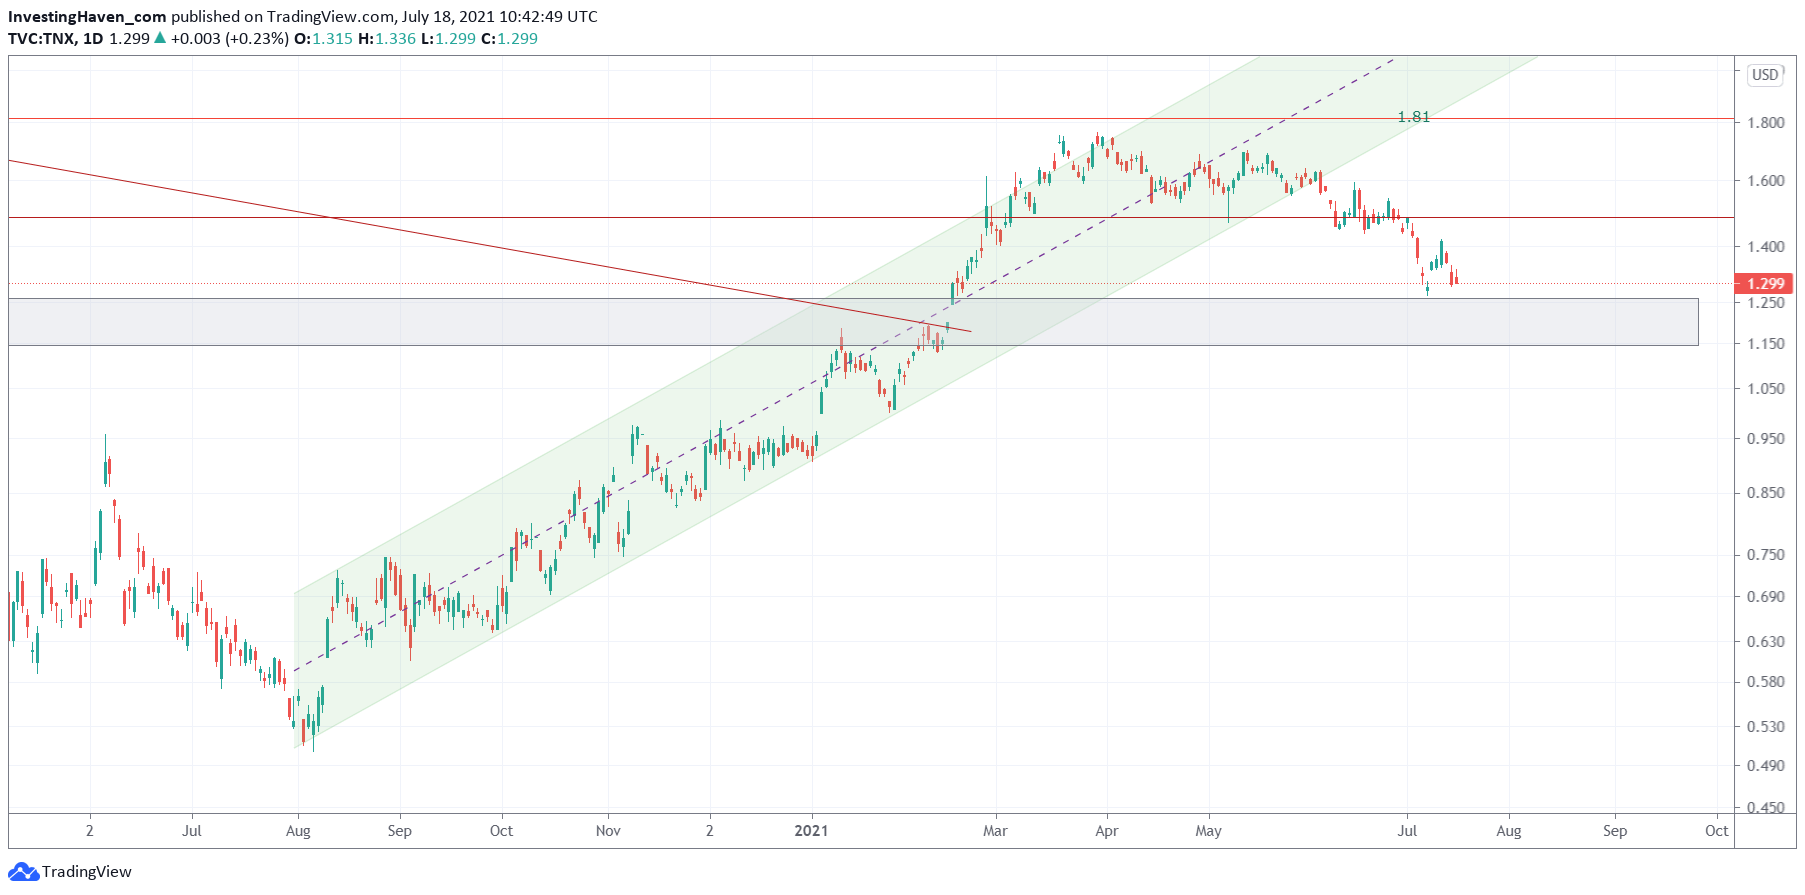
True, and that’s because bond yields were falling in that period. So gold has a 3d leading indicator: bond yields. They are also inversely correlated.
- Bullish case for bond yields: they find support around current levels and start rising soon. This has an extremely low probability.
- Bearish case for bond yields: they continue to decline to the lower part of the grey support area. This will be good for gold, especially if the USD stabilizes or preferably comes down.


