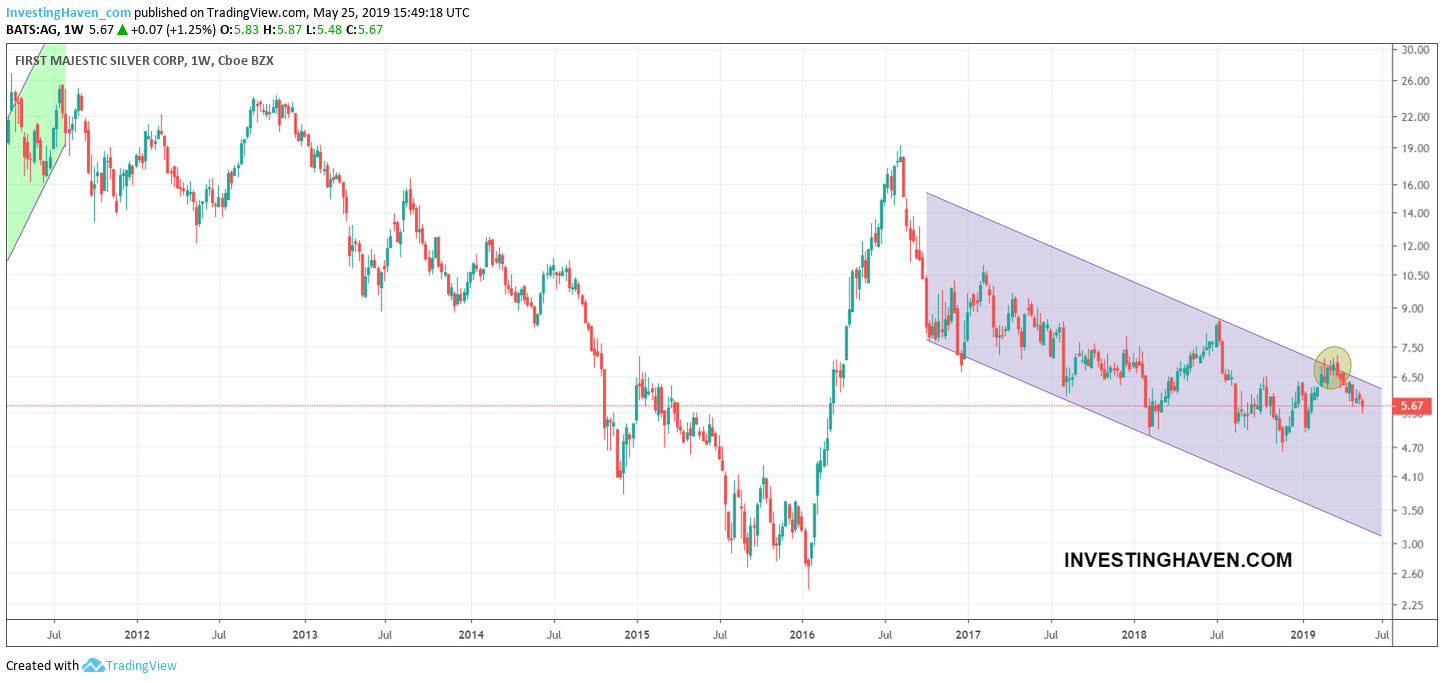
In February this year we identified a breakout in progress for First Majestic Silver (AG). Without any doubt First Majestic Silver was and still is the most attractive silver miner. When we wrote our silver price forecast (SILVER) as well as silver miners forecast (SIL) we predicted a breakout in silver markets in 2019 with the outperformer being AG as per our First Majestic Silver forecast. Since then, though, we have seen the stock price of First Majestic Silver, it lost some 24 pct since then. Is all lost or is it a matter of time until the magic returns to the silver market?
First Majestic Silver: Top Silver Stock Even After The Failed Breakout
We really like First Majestic Silver a lot. When we say a lot, we really mean a lot.
Both fundamentally as well as chart-wise this is the top silver stock in the world.
First, the chart.
The failed breakout in February 2019 is visible on the weekly chart (yellow circle). It is clear that the stock continues to fall but without a bullish trend change in both gold and silver.
So instead of looking too much into the AG chart we really have to focus on the gold and silver price charts which we included below.

Moreover, fundamentals are awesome. In the quarterly earnings released early May for the period ended March 31st, 2019, we see an impressive result. Frankly, we do not care whether this is right above or right below estimates from the gurus out there.
For in the case of First Majestic Silver it really (really) simple and straightforward: it is directly correlated to the silver and gold prices. Moreover, the way to play this stock is simple: once gold and silver break out the top precious metals miners will do amazingly well. Simple, right?
From the press release that discussed the latest earnings report:
AG realized an average silver price of $15.73 per ounce during the first quarter of 2019, representing a 6% decrease compared with the first quarter of 2018 and a 9% increase compared to $14.47 in the prior quarter.
Revenues generated in Q1 totaled $86.8 million, an increase of 48% compared to $58.6 million in Q1 2018.
AG reported mine operating earnings of $10.3 million compared to ($0.4) million in Q1 2018. The increase in mine operating earnings in the quarter was attributed to the San Dimas and Santa Elena mines, which generated mine operating earnings of $11.2 million and $5.1 million.
Cash flow from operations before movements in working capital and income taxes in the quarter was $23.7 million ($0.12 per share) compared to $15.6 million ($0.09 per share) in Q1 2018.
AG generated net earnings of $2.9 million (EPS of $0.01) compared to ($5.6) million (EPS of $(0.03)) in Q1 2018. Adjusted net earnings for the quarter was ($2.9) million (adjusted EPS of $(0.01)), after excluding non-cash and non-recurring items.
Cash and cash equivalents at March 31, 2019 was $91.5 million, an increase of $34.5 million compared to the previous quarter, while working capital increased to $130.9 million. The increase in cash and cash equivalents was primarily attributed to the sale of 5,250,000 common shares of the Company through its “at-the-market distribution” program at an average price of US$6.34 per share for gross proceeds of $33.6 million.
Silver Price: Consolidation In Major Triangle Pattern
We really have to focus on the silver price in order to tell something meaningful about First Majestic Silver. As said above the fundamentals of silver stock First Majestic Silver are awesome, so there is nothing concerning when it comes to the stock (on the contrary).
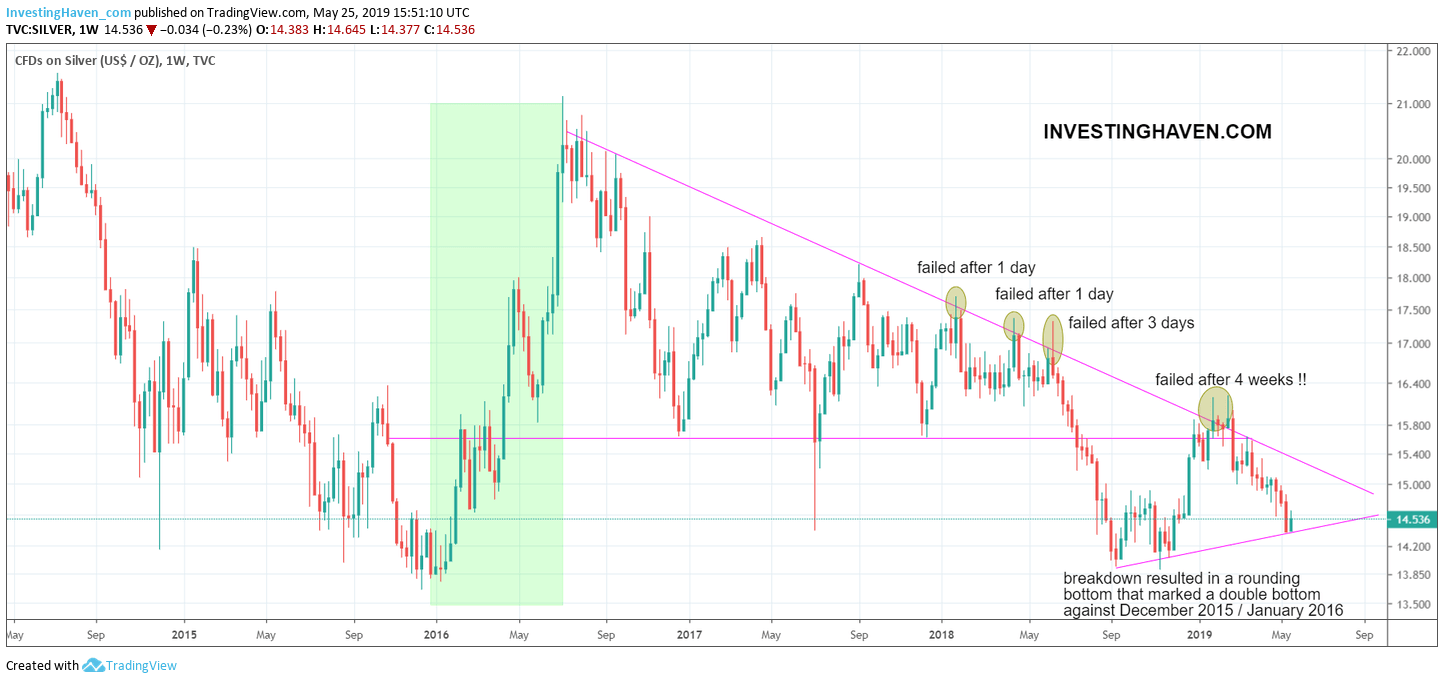
The price of silver shows why the price of top silver stock First Majestic Silver is facing some headwinds. Silver’s weekly price chart shows this struggle to break above the falling resistance line of the triangle pattern that started in 2016.
Interestingly, there have been some 4 attempts to break out (see yellow circles) but they all failed. The last one was an attempt that took 4 weeks (though without consecutive closes above resistance) only to resolve to the downside.
What are we looking for? Very simple, the price of gold, as that’s the leading indicator for the whole precious metals complex, including the silver price and any silver stock like AG.

Gold Price: Leading Indicator, Many Attempts To Break Out Failed
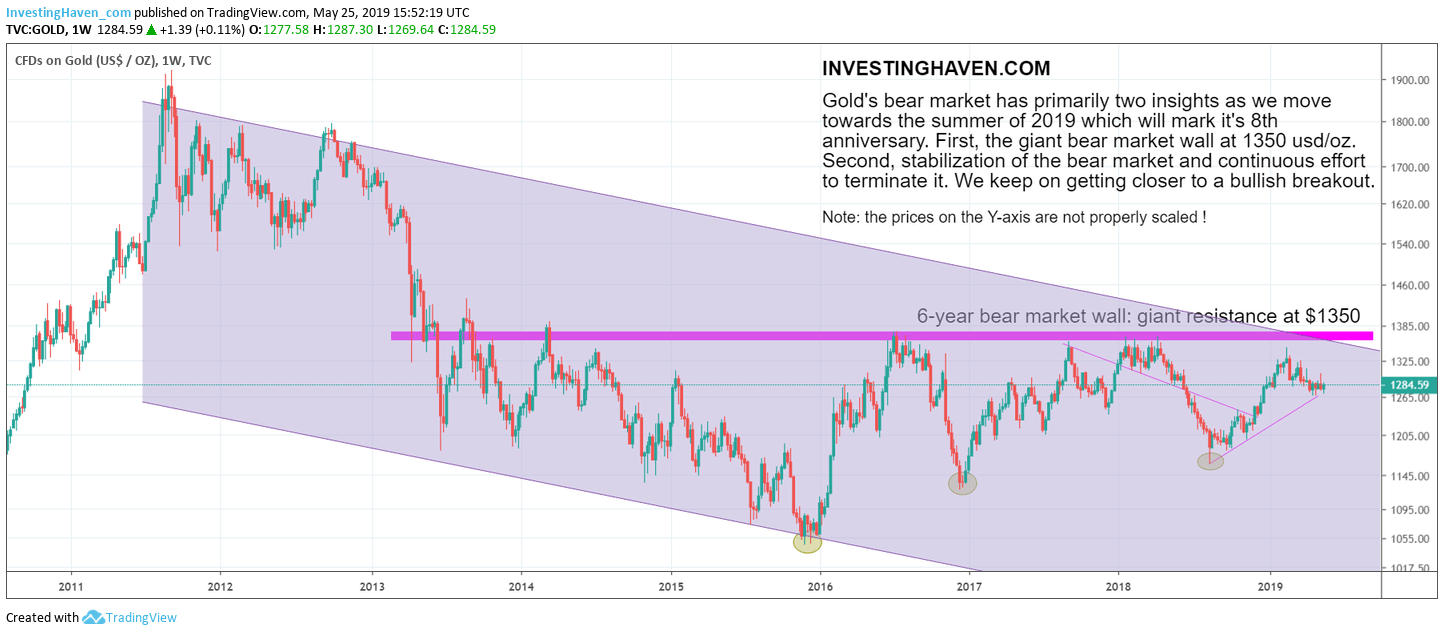
The gold price chart looks constructive with a series of major lows since December of 2015 (see 3 yellow circles). However, gold’s giant bear market wall is the root cause for all hesitation in the precious metals market.
Watch how gold continues to try to break above $1350, but every attempt failed so far. We are now ‘celebrating’ the 6th anniversary of the crash below $1350, and since then gold did not manage to close above $1350 for 3 consecutive weeks.
Is there more downside in gold? If $1265 gives way to a breakdown we may see a retest of the $1200 and ultimately $1170 area.
As per our interview with MarketWatch Featuring our Gold Prediction of $1550 we expect an upside breakout later this year as there seems to be more upside than downside potential in gold.
In case a breakdown in gold would occur (not like, but you better never say ‘never’ in markets) then we anticipate a delay of bullish momentum. Note we say a delay, because there will be a time that the tide will turn in the gold market, and if it’s not in 2019 it will be in 2020!


