In the last 2 months gold has essentially gone nowhere. Does this imply that a consolidation is set to continue for the remainder of 2020? Or is a new trend coming up? We believe it is a matter of time until gold starts trending.
Let’s forget about gold fundamentals, and focus on the gold price chart only.
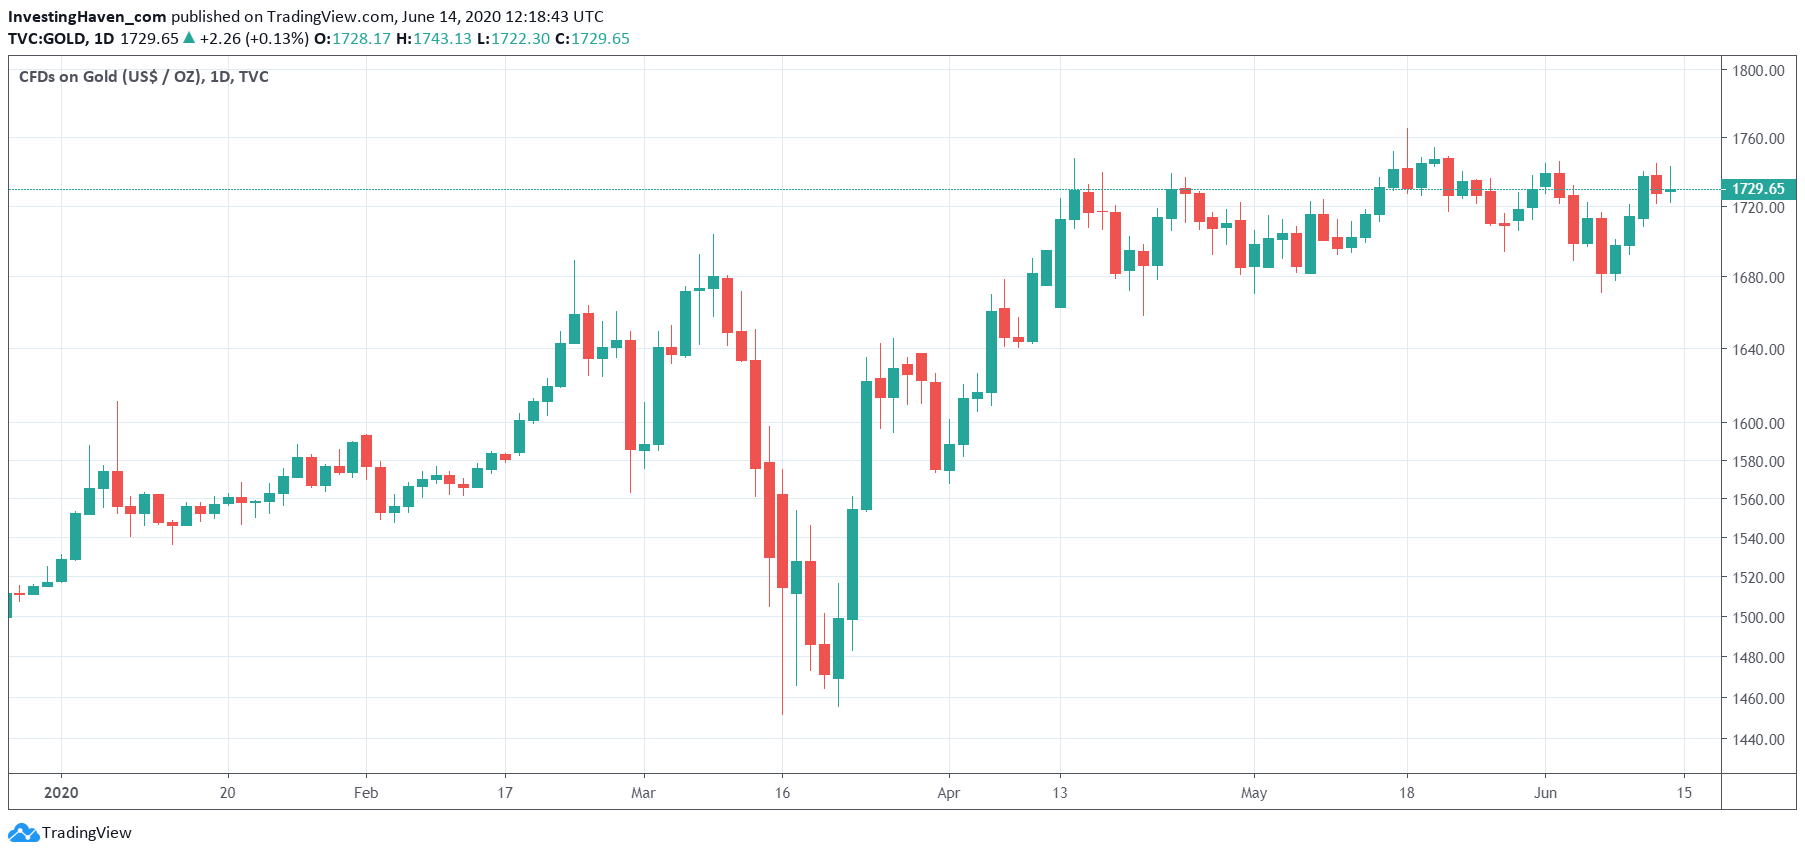
The daily gold chart says it all: a pretty nice consolidation over the last 2 months.
Astute readers have noticed that we included a chart without any annotation. Pretty odd, as InvestingHaven is really known and respected for advanced charting.
True, but sometimes chart annotations can prevent us from seeing the obvious. Case in point: the daily gold chart.
Anyone who has a sharp eye for chars can see a consolidation with a bullish bias on the gold daily chart. However, there might also be a bearish scenario in play in recent weeks.
And that’s the entire story in the gold market: a strong bullish bias with a bearish influence in recent weeks. We would say 80/20, but as we all know the 20% should always be taken seriously as it can grow into something bigger.

We also do know that consolidations are the most tiring type of ‘events’ in markets. They shrugg off bulls and bears.
All of us learnt the hard way to simply wait for a consolidation to end, and show a new trend.
Easy learning, but very (very) tough for investors to apply. Probably one of the toughest things for investors is to simply WAIT for a new trend.
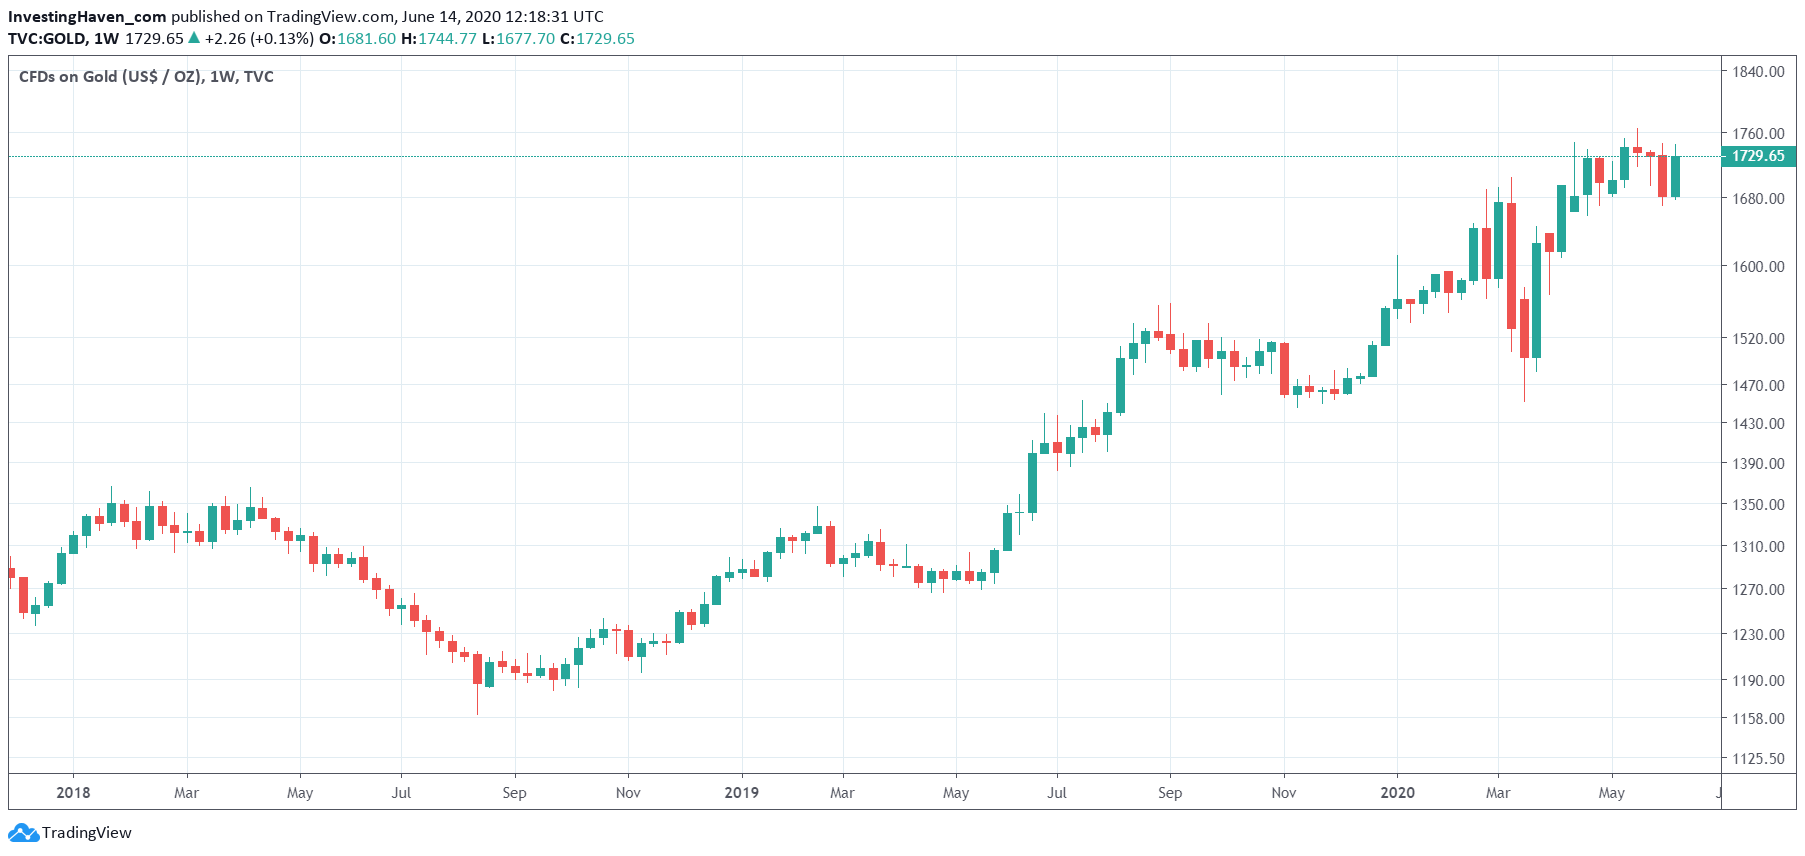
If we zoom out on the weekly chart we’ll see the ongoing consolidation in context.
Below is the weekly gold price chart. In the end we see 8 ‘meaningless’ candlesticks on a wildly bullish chart.
Patience is all we require in the gold market. It will be require sooner rather than later which direction gold wants to go. The weekly chart suggests up, the daily chart should overcome a bit of bearishness of last week(s) (not a lot though).


