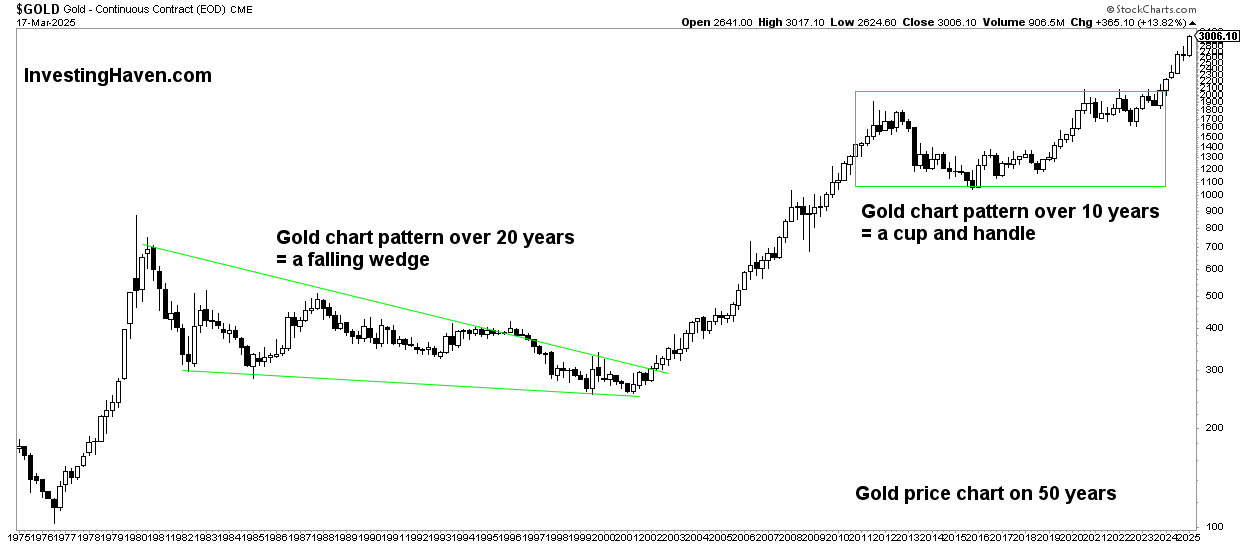
Gold completed its powerful bullish cup and handle pattern, on March 4th,2024. Gold should set new all-time highs, also in 2025, but here is one important bull market condition: gold should trade above $2,650 on Dec 31st, 2024.
RELATED – Gold prediction 2025 till 2030.
Gold has stood the test of time as a reliable measure of prices and a symbol of stability during times of economic uncertainty. In the face of rising prices across all sectors, it comes as no surprise that the price of gold is also following suit.
While gold may not have surged significantly in relative terms due to the disinflationary monetary policies of central banks, it is only a matter of time before it catches up and sets new all-time highs (ATH).
The long term gold price chart (gold in USD) has a setup that confirms gold’s intention to move higher. When expressed in leading world currencies other than the USD, gold has consistently made new ATH in 2024.
Is gold expected to set a new all-time high (ATH)?
This article explores the factors behind gold’s objective measure of prices and its potential to soar in leading world currencies, ultimately answering the questions “is gold expected to move higher” as well as “is gold set to reach new all-time highs.”
We take an objective and data-driven approach in this article. We try to avoid, at all costs, bias and preferences.
That’s why we cover the following points in order to answer the aforementioned questions:
- 1. Why Invest in Gold When Rates Are Rising
- 2. Gold as an Objective Measure of Prices
- 3. The Disinflationary Effect on Gold
- 4. Gold Price Chart Analysis
- 5. Gold in Leading Currencies
- 6. Is Gold Expected To Move Higher?
- 7. Is Gold Set To Move To New All-Time Highs (ATH)
Why invest in gold when rates are rising
With interest rates reaching levels not seen since 2001, investors face tough decisions on where to allocate their funds.
Although assets like bonds may offer attractive yields in a rising rate environment, gold remains a preferred choice due to its ability to preserve value during inflationary times and instill confidence during economic uncertainties.
The price of gold often reflects market sentiment, acting as an inflation hedge and/or a safe haven in times of crisis.
Note that our point is that gold can be rising either as a reaction to inflationary pressures, or in times of crisis, or both. The latter does not occur often. We try to point out the dominant dynamics influencing the gold price.
Gold as an objective measure of prices
- Amidst soaring inflation rates and skyrocketing prices, gold stands as a benchmark of real value.
- As all prices move higher, the price of gold inevitably follows, albeit with a slight lag. We attribute this lag to the disinflationary monetary policies implemented by central banks worldwide.
- Yet, despite this lag, gold’s reliability as a measure of prices remains unparalleled, making it an essential asset for investors seeking an objective anchor in turbulent times.
The disinflationary effect on gold
Disinflationary monetary policies pursued by central banks ensured that gold could not rise in the period 2022-2023, despite high levels of inflation.
As these policies aimed to stabilize or reduce the general price levels of goods and services, they did impact the immediate gold’s upward trend. However, it is essential to recognize that these disinflationary policies are temporary and are not reflective of gold’s long-term value.
Eventually, as the inflationary pressures build and the impact of central bank policies diminishes, gold will surge and make up for the relative lag experienced during the disinflationary phase.
Moreover, as evidenced by the latest monetary news, policy makers are starting to cut rates.
This is happening at a time when central banks buy large quantities of physical gold, with the intention to protect their
So while the origin of the central banks buying gold may have changed over the years, the reasons for holding the asset have changed little.
On the flipside, rising Yields since Sept 18th are preventing gold from moving higher at an accelerated pace.
Gold price chart: gold’s cup and handle chart pattern
The gold chart over 50 years presents an outspoken pattern known as a “cup and handle” reversal, which bodes well for gold’s future prospects. The “cup and handle” pattern is a bullish continuation pattern.
It typically indicates a brief pause in a rising trend before the price resumes its upward trajectory. In this context, the “cup” portion of the pattern represents the gradual decline in the gold price, forming a rounded bottom. Conversely, the “handle” is a minor retracement that follows the cup formation.
The chart showcases this pattern, signaling a potential bullish breakout in gold prices. The cup formation, spanning over several decades, indicates a prolonged accumulation phase, during which investors have gradually built positions in gold.
As the cup formation concludes, the handle portion serves as a consolidation before the next upward move. That’s exactly what started happening in March of 2024 – it marked the start of a new bull market!

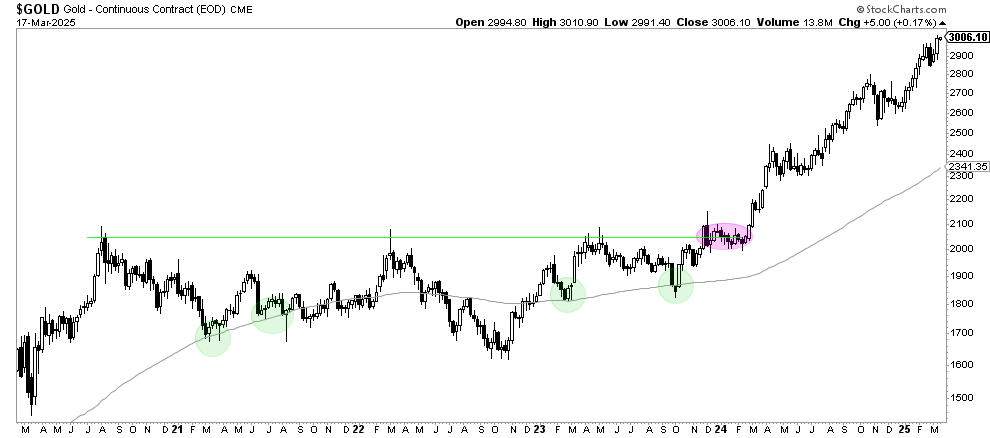
We now zoom into the gold price chart, and look at the 5-year gold chart.
Clearly, the series of reversals since summer of 2020, that make up the consolidation, has a very bullish looking.
The long term moving average on the weekly gold price chart is rising, price is well above this moving average.

The take-aways:
Gold’s cup and handle reversal pattern and gold’s long-term channel paint a promising picture for gold’s future outlook. Gold price chart analysis confirmed a bullish breakout would occur in 2024, already back in 2023, it happened on March 4th, 2024, a date for history books.
Note, though, that the above charts show the price of gold in USD. Just these gold price charts, in and on themselves, suggest with a high level of confidence that gold wants to move higher and set new all-time highs.
It will get even more interesting, as we will see in the next sections, when considering gold denominated in currencies other than the US Dollar. It is important to emphasize that gold has already made new ATH in several leading world currencies.
The bearish case: a wedge? The importance of March 31st, 2025, gold spot closing price.
It is imperative to always assess the opposite view. While all data points suggest a bullish outlook for gold, we look at a potential bearish viewpoint in this section.
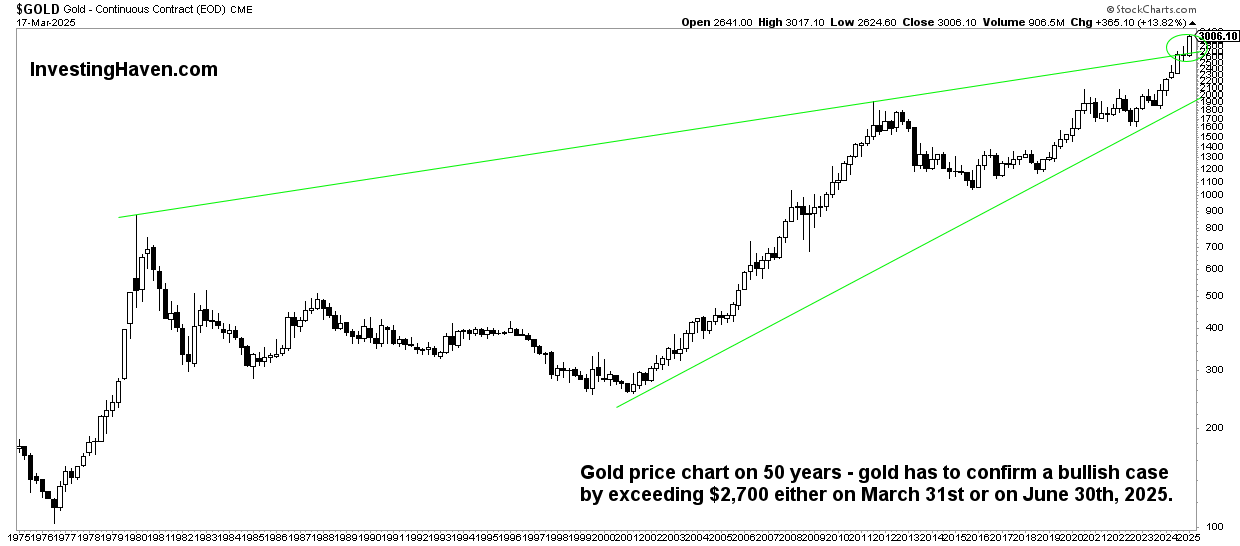
The exact same gold price chart shown above has a different pattern in the making: a rising wedge.
As seen below, this rising wedge spans 44 years of gold price data, an incredibly long and phenomenal setup.
At this point in time on March 18th, 2025, the rising wedge on this chart is invalidated!
- Ultimate confirmation? The quarterly closing prices will matter – on March 31st, 2025 and June 30th, 2025, gold should be trading well above $2,650 in order to invalidate the potentially bearish case.
We know exactly what to look for to know with a degree level of certainty if/when the bearish case invalidates.

Gold in leading currencies
Investors primarily measure the price of gold in USD terms. The price of gold expressed in other leading world currencies, such as the Japanese Yen and Australian Dollar, emphasizes gold’s value.
That’s why it is misleading, to some degree, to only focus on the gold market when looking at the gold price chart denominated in the US Dollar.
Over the last 12 months, these currencies have shown a pronounced upward trend when paired with gold. This demonstrates the strength of gold as an objective measure of prices in different regions, offering investors protection and stability in relative terms.
The most pronounced view is how gold performed over the last 4 years, when denominated in 9 leading world currencies. All of these charts feature a strong uptrend:
- Either in the form of a continued uptrend – gold in Japanese Yen, gold in Indian Rupee, gold in British Pound),
- or in the form of a W-reversal in the form of a rounded reversal which is a very powerful chart pattern – gold in Chinese Renminbi, Swiss Franc, South African Rand.
Below are the 4-year gold price charts denominated in 20 leading world currencies. Visibly, gold is in a secular uptrend in all global currencies irrespective of a potential pullback that may occur in 2024.

Is gold expected to move higher?
As the era of monetary tightening approaches its conclusion, the spotlight is on the trajectory of gold prices, and the indications are increasingly optimistic.
Over the past decade, the value of gold has soared across various global currencies, showcasing its resilience and allure as a preferred investment choice.
Gold is performing remarkably bullish in the last 12 months. Gold is expected to continue to move higher even if it retraces to its March 2024 breakout point at $2,100 an Ounce.
Is gold set to move to new all-time highs
Indeed, gold is likely going to continue to make new all-time highs in 2025. The lags experienced in relative terms proved to be temporary.
The objective measure of prices that gold represents, coupled with its potential in leading world currencies, solidify its position as a valuable asset in any well-diversified investment portfolio.
Gold’s enduring appeal as an objective measure of prices is undeniable. While it may have experienced a relative lag in the face of disinflationary policies, its long-term trajectory points towards new all-time highs.
Inflationary pressures have risen a lot, interest rates have risen a lot, still gold has shown resilience. As soon as central banks started thinking about cutting rates, early 2024, gold staged a secular breakout. This happened when inflationary pressure seemed clearly under control.
In leading currencies, such as the Japanese Yen and Australian Dollar, gold’s strength is evident, reaffirming its status as a universal store of value. With the potential for central banks to adopt more inflationary policies, gold will likely move higher and reach new all-time highs.


