Our gold price forecast for 2019 which we published exactly one year ago couldn’t have been more precise. We said gold’s price would rise to $1550, again that was a prediction made in Sept last year. Exactly one year later we saw gold moving to $1565 after which it started a retracement. Most likely this retracement has legs, and most likely it will end around $1400. That’s when we believe gold will become a STRONG BUY again.
We explained in our annual gold price forecast that we apply 3 leading indicators for gold’s price: the Euro, gold’s COT (Commitment of Traders report) and real rates.
Argualy, inflation expectations as reported by TIP ETF should be part of the leading indicators. It might replace real rates in our next annual gold price forecast which will be out in a few weeks from now.
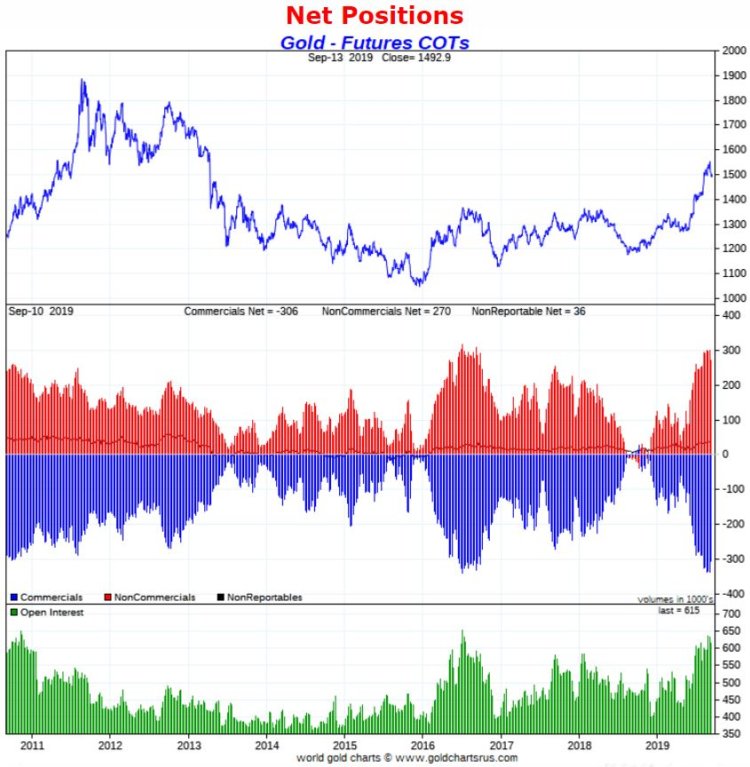
The COT report clearly suggested that gold’s price had (way) too much stopping power because of the extremely high net long positions of non-commercials!
As said in the past the way to read the COT as it relates to forecasting gold’s price is to look for extreme positions.
Now if we combine the COT report data (courtsey of Goldchartsrus) with the chart setup it becomes clear that gold is due for an important break. This may last weeks or months.
Readers know by now that it’s hardly possible to forecast short term price movements.
The most likely path of gold is that it retraces to its breakout level which is $1400. What gold bulls want to see is a substantial reduction in the net positions of non-commercials. If that’s the case we will likely flash a strong buy on gold, silver and precious metals miners.
One of the likely scenarios is that the Euro, the other leading indicator, will have corrected sufficiently before starting a big move up.
If all of the above coincide it would be the best case outcome for gold bulls! That’s also when we’ll be again on Marketwatch with a similar market call as the one of May 3d this year: Why gold’s a ‘bargain’ at less than $1,300 an ounce.


