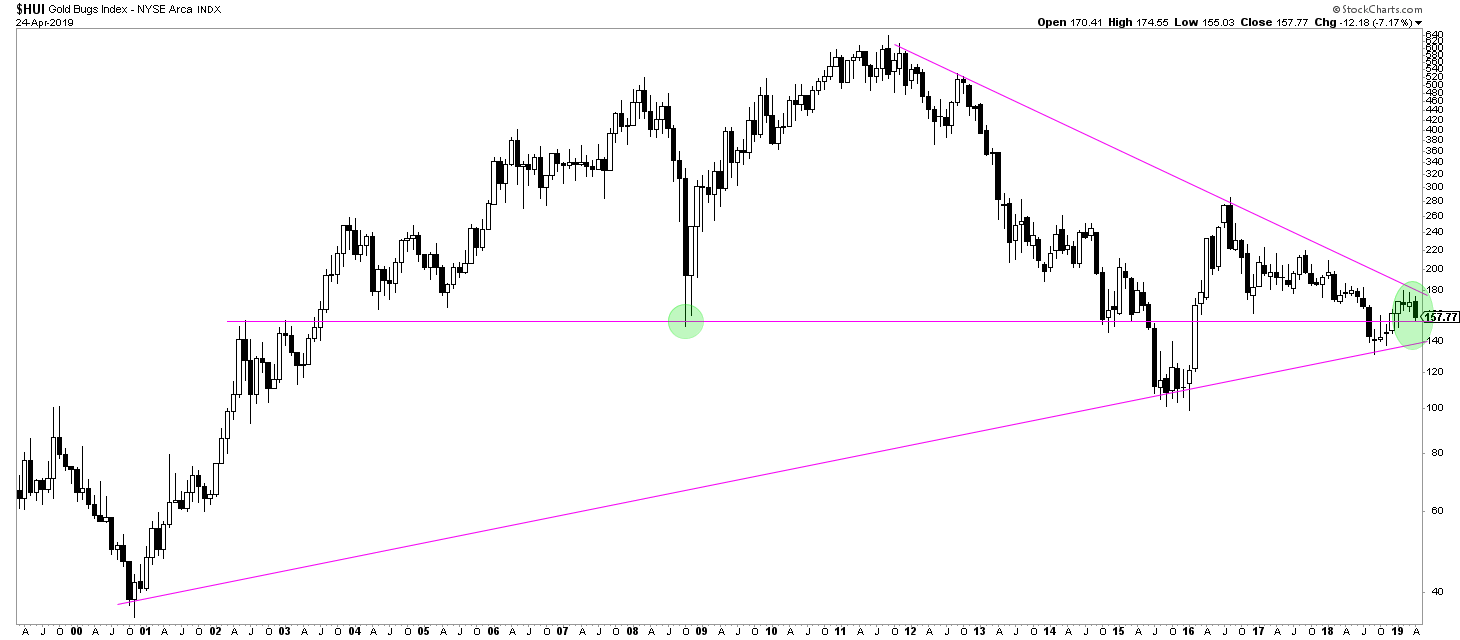
The chart of the best gold stocks (GDX) shows extreme pressure. It is likely the sector under the highest pressure right now based on the chart setup. No coincidence, gold (GOLD) is pushing for 6 years to break through its giant gold bear market wall. As gold is still on track to meet our gold forecast and the long term gold charts look constructive there is a high probability that gold stocks will break out big time. However, the opposite may happen as well, and investors must be aware of it.
This article only looks at the chart, not at fundamentals in the gold market.
Especially the gold mining sector, represented by the HUI index, is a pressure cooker like there is hardly any other market at this point in time.
The monthly gold stocks chart makes the point, and does not require any explanation. This giant triangle pattern is what should catch every investor’s attention.
This triangle pattern is in the making for 19 years!
Interestingly, the HUI index trades at the same point as it did in 2008. It is one of the few sectors in the stock market that is still trading at similarly low levels as in 2008, 10 years after the financial crisis happened. Talking about undervaluation and a beaten down sector.
Likely, it is here that great value is available, especially knowing that the price of gold trades 50% above the 2008 period.
We are convinced it is a matter of months, likely summer of 2019, when this sector will erupt. The trillion dollar question is in which direction will it start moving?
Our case is that the probability is higher that this sector goes up. That’s because leading indicators in the gold market favor higher gold prices, not lower gold price.
The price points to watch in the HUI index is 140 points at the downside and 170 points at the upside. Any sustained break above or below it will result in a massive move up or down!


