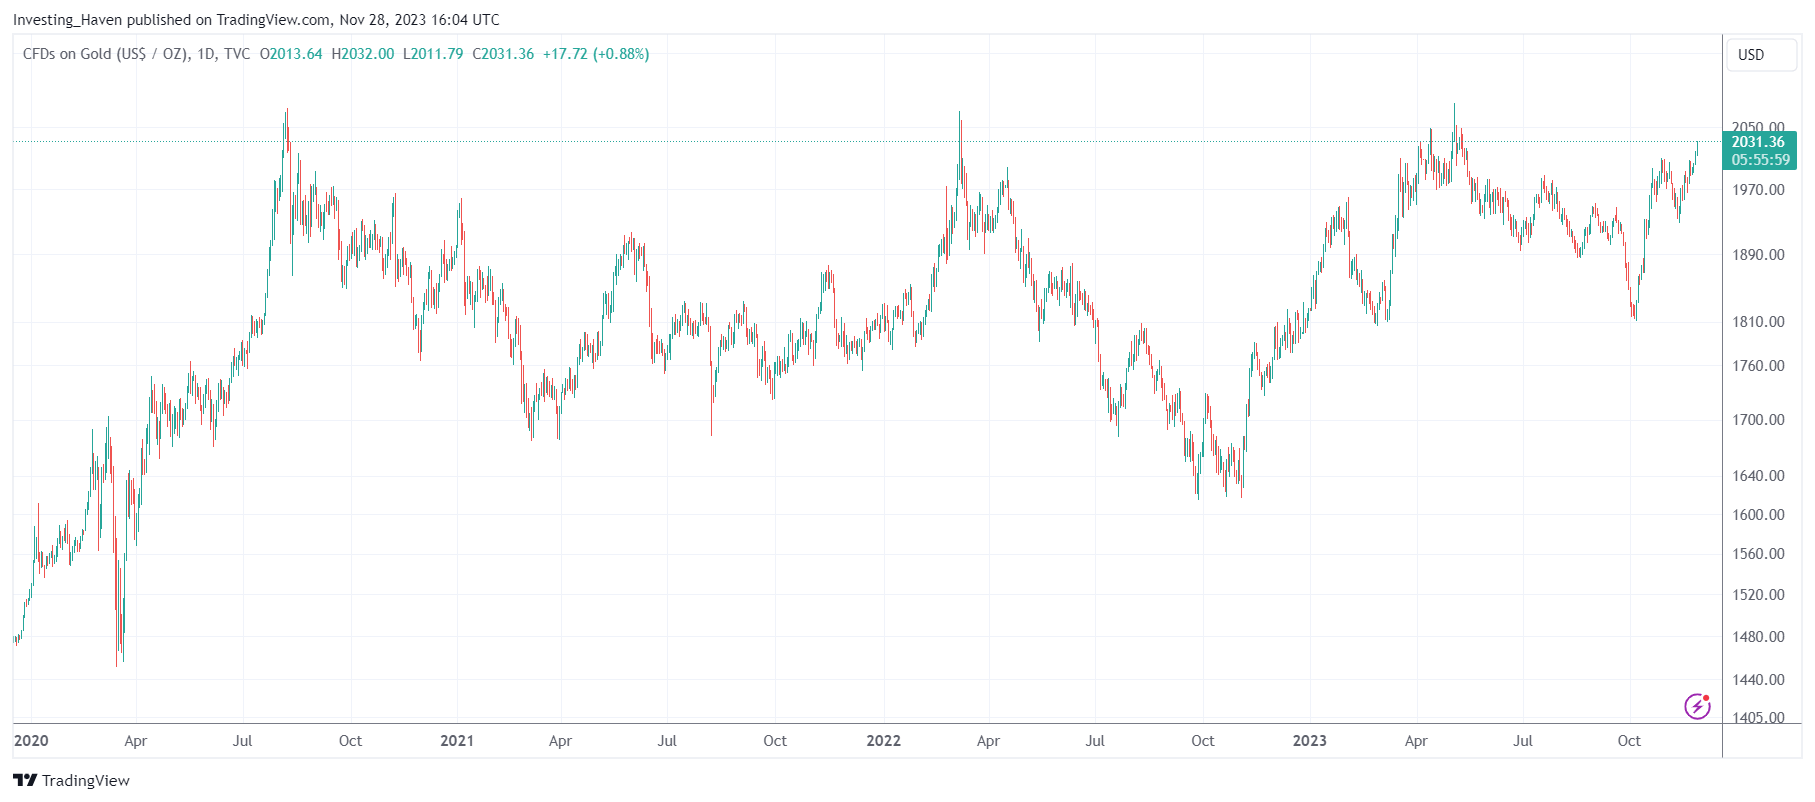
Gold is very close to testing all-time highs. The question top of mind of investors is whether gold’s breakout attempt, its fourth one, will be successful. How to know whether gold’s breakout to new ATH will be successful?
We have addressed several gold related questions lately. Let’s review them, before we look at the up to date gold charts.
We asked the question whether gold will print new ATH in 2024. Our answer: Yes, we are convinced that gold is on its way to print new all-time highs, in the first quarter of 2024 presumably.
In a very detailed analysis, we looked at our gold forecast 2024, concluding this: “The price of gold will surpass $2,000 in 2024. Gold’s leading indicators are directionally bullish, we predict $2,200 in 2024.”
By looking at a diversity of factors, we also confirmed that gold is expected to move to new ATH, one which the gold price charts combined with gold denominated in other currencies.
Last but not least, very recently, we pointed gold’s highest monthly closing price being 1989.62 USD/oz:
The pressure cooker analogy for gold’s chart comes into play when we discuss surpassing the highest monthly closing price. Hitting a new high above 1989.62 USD/oz is a significant milestone, one that could potentially trigger a strong upward movement. Breaking through this level would signify that gold has overcome the triple top formation, opening up a path to explore higher price ranges.
Now that’s one of the most important factors to bring up: gold is about close the month with the highest monthly closing price in its history, at least that’s the highest probability outcome.
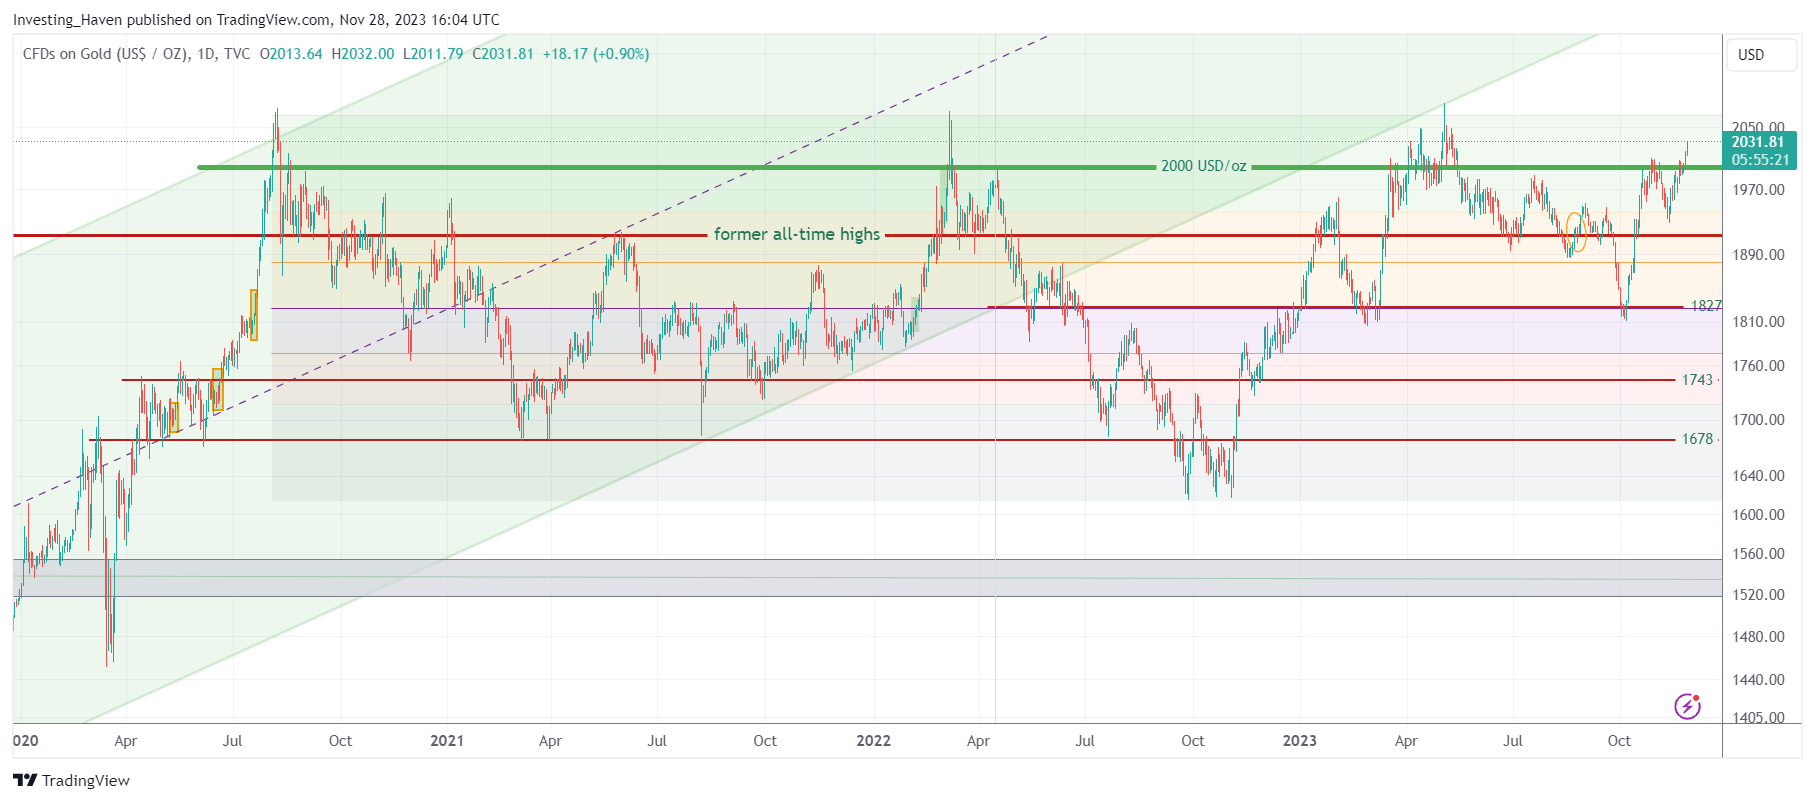
The chances of this next touch of 2070 USD/oz (former ATH, marking a triple top) to give up, resulting in a secular breakout, is very high.
Gold’s daily chart shows this triple top marked by a long consolidation.
Above all, the recent rise started around 1825 USD/oz, which is just a 10% rally. The previous 3 tests of ATH started from 1480, 1680 and 1620 USD/oz.
In other words, the previous rallies exhausted once they got at 2070, but this ongoing rally may not be exhausted at all.
If we add our chart patterns and annotations to the gold price chart, we can clearly see how the recent drop, early October, pushed gold exactly to its 50% retracement level.
That’s a powerful test, also a straight message, a bullish one in our opinion.
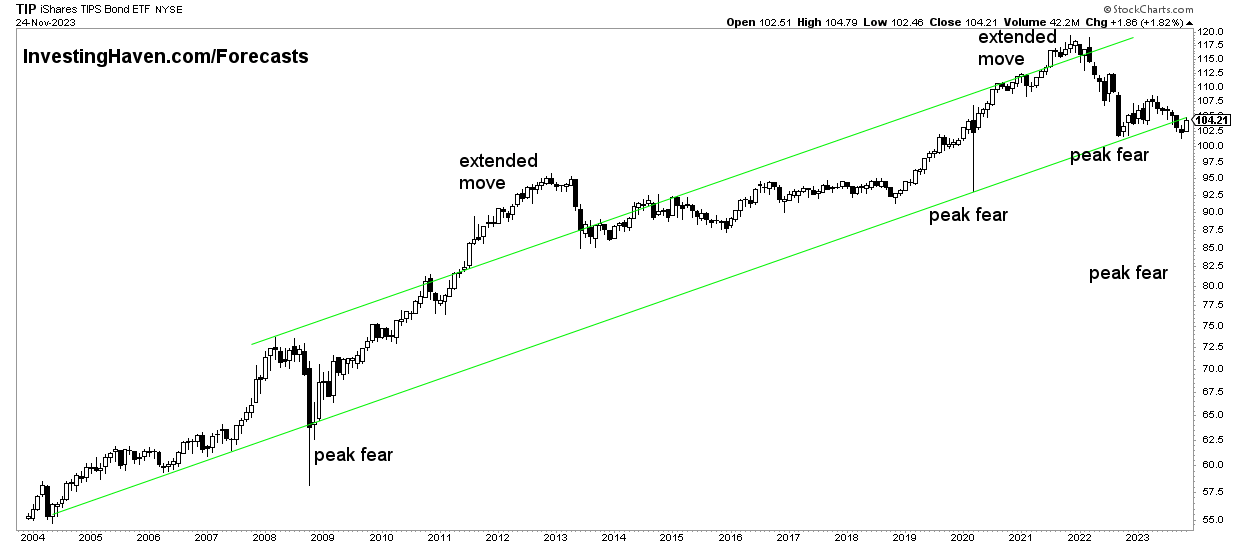
Moreover, from a leading indicator’s perspective, inflation expectations are setting a double bottom, right at the long term rising channel.
Note that tests of support within the rising channel have always coincided with ‘peak fear’. They have always resulted in a rise in inflation expectations which is strongly correlated with the S&P 500 and gold/silver.
Gold Prediction for 2024
For all those reasons, it seems very likely that gold will take out 2070 USD/oz in the not too distant future. Although a mini-retracement, after touching ATH, is likely, we don’t see a huge drop of 20% like we saw in the previous occurrences (even not a drop of 10%).
The ‘worst case’ outcome is a smaller drop combined with a longer consolidation right below 2000 USD/oz. The highest probability outcome is a slow rise above 2070 USD/oz, likely to the first target which is 2200 USD/oz.
We offer detailed gold & silver price analysis, as a premium service, covering every week leading indicators of the gold price and silver price. Premium Service: Gold & Silver Price Analysis >>
In case you prefer to let us do the hard work while you focus on other challenges in your life, you might want to consider our unique passive income service >>


