It was a chaotic week in markets, and it started right after the release of the FOMC meeting minutes. We are not talking volatility, we are talking counter-trend moves that create havoc and fade one day later, particularly bond yields. Silver and other metals were hit relatively hard. The million dollar question is whether the prospects of silver now turned sour after it started an epic breakout exactly one week ago, ready to move to our most bullish predicted silver targets for 2021.
We want to revisit the strength we saw when we reported it one week ago in 5 Reasons Why Silver Should Resolve Higher In 2021:
- The daily silver price chart. Silver is now above 3 trendlines, and did successfully test its breakout point on Thursday. Very promising, see below chart.
- The weekly silver price chart. In essence the backtest from last Thursday occurred at a secular level that goes back 11 years in time! Bullish.
- The USD is not yet in a position to push back precious metals. Eventually it will, but that’s not now.
- The bond market is opening the door for precious metals to thrive. Want to know more about this fascinating intermarket trend? Please read this article.
- Anecdotal evidence comes from our mailbox. In our Momentum Investing portfolio we went overweight in silver miners in the last 3 weeks. Some members are doubting this is a wise thing, especially because of the USD and the fact ‘we are buying high’. This, for us, is the ultimate evidence of silver to move higher: concerned investors amid a great silver chart and phenomenal intermarket dynamics.
Let’s review, one week later, where the silver market stands against these 5 observations:
- Silver fell below the 3 trendlines. However, it is nowhere near a breakdown level. Most likely, the outcome is a continued consolidation which will only make the bullish outcome (if and when it happens) so much more powerful. The question is: will the outcome be bullish or not.
- Silver is 0.3% below that 11 year secular trendline, we can consider at this point in time a backtest, until a bearish pattern arises.
- The USD gained strength, starting right after the FOMC minutes were released. The USD is the only threat to silver right now. The USD is strong, but we don’t think it’s strong enough to make the precious metals market melt down completely. That’s an assessment, the market has to prove this right or wrong.
- The bond market continued its move higher (yields lower) even after the spectacular rise on Wednesday, post-FOMC. This sudden and strong rise in bond yields, combined with the USD, caused precious metals to sell off. However, the bond yields rise lasted for a few hours only, Thursday intra-day they started coming back, and continued the path lower they were on since the week before.
- Anecdotal evidence: silver investors are now seriously concerned. The chart pattern doesn’t reflect a serious concern, as of yet.
This is what we wrote in our latest premium research service alert, and it’s only a tiny piece of the detailed market analysis we shared with our members:
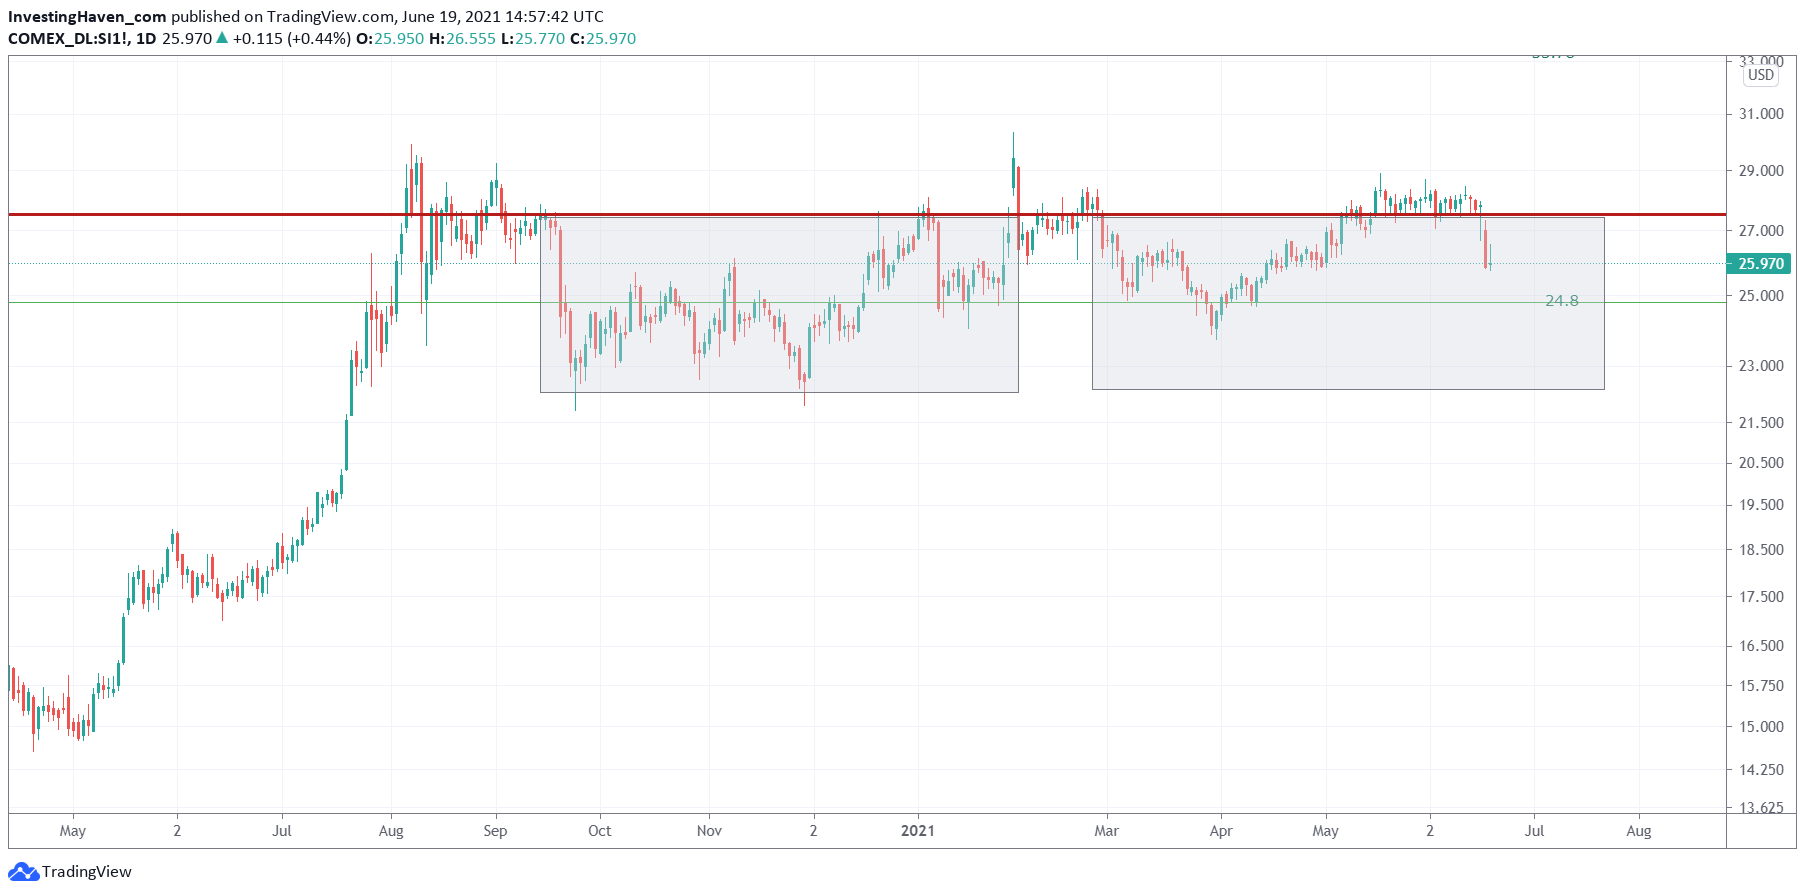
The most likely path, according to us, is that silver is now going to print a handle in a cup-and-handle formation. Below chart makes the point:
- We had a first cup-and-handle between September and January, first grey box.
- The second cup-and-handle started in March, and the decline of this week might be the start of a ‘handle’.
This assumes a good outcome, not a strongly bearish outcome, for both gold and silver.
The first ‘handle in the first grey box took some 4 to 5 weeks to complete. Assuming the market is going to print a similar setup now we believe the current ‘handle’ might take a comparable amount of time to complete.
The chart below shows these 2 grey boxes which, according to us, represent two distinct cup-and-handle formations. The market has to prove this right, but we expect the recent decline to be the start of the 2nd ‘handle’.
Bullish on silver until proven otherwise, and the micro-pattern we’ll see next week on both charts of gold and silver will be telling.


