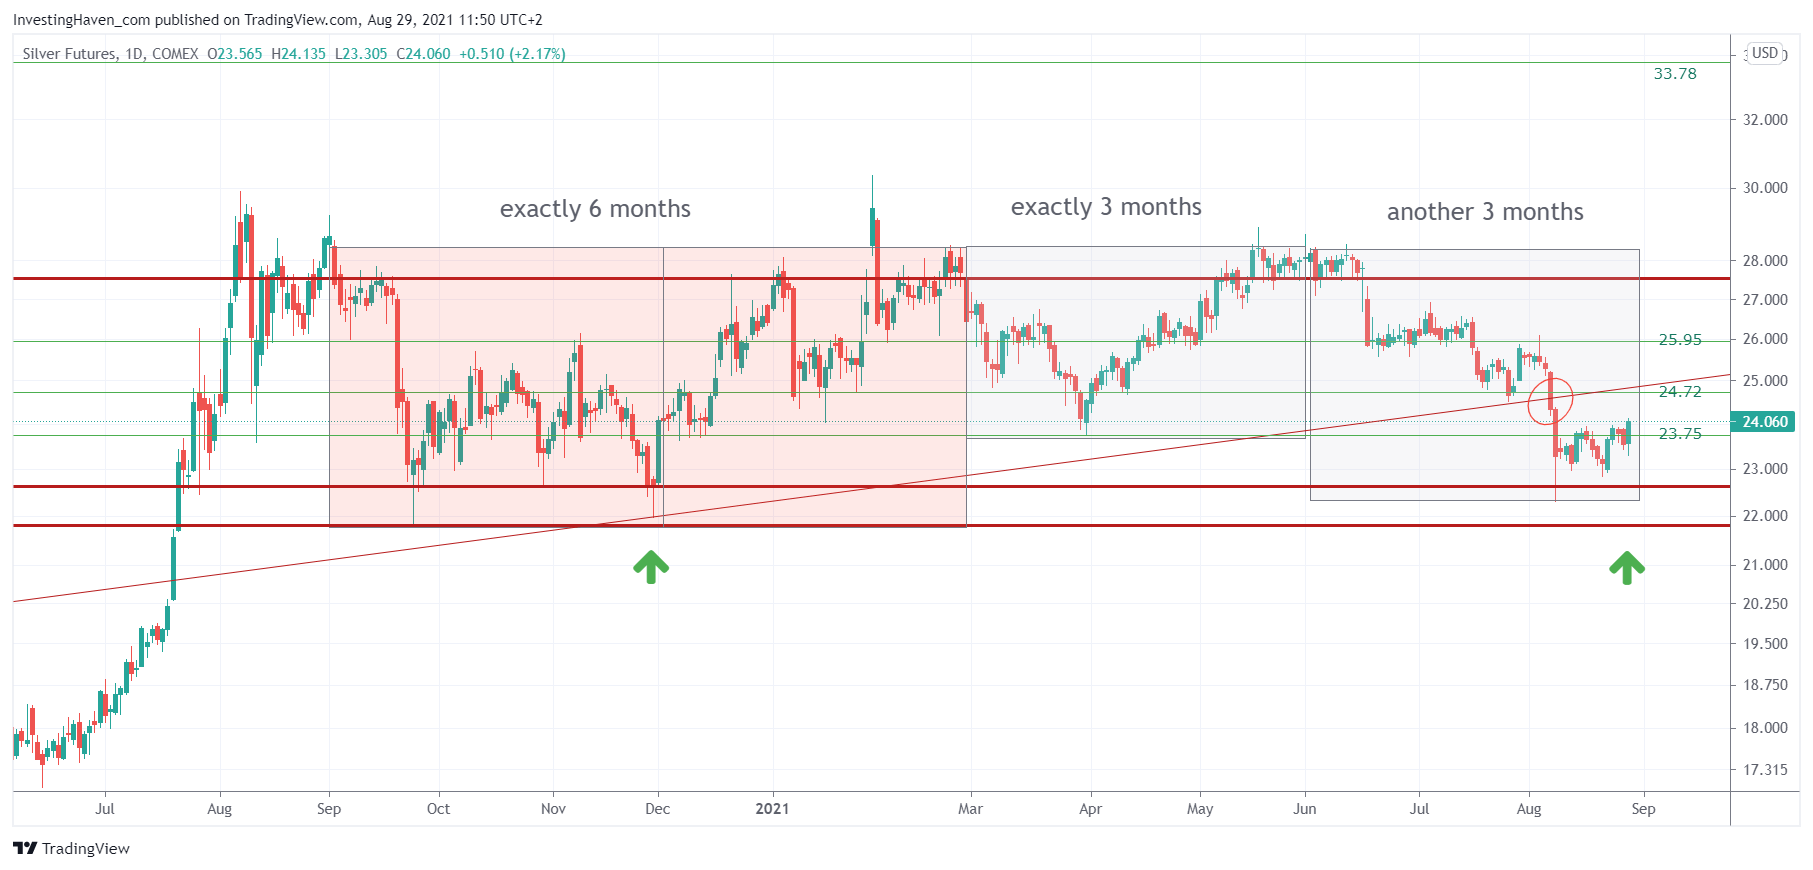
The silver price chart is now officially our most bullish chart of 2021. Our silver price forecast 2021 of the higher 30ies is certainly underway, it’s a matter of time.
Among the few bullish price charts we have identified for 2021 there is only one market that hasn’t ‘erupted’ yet: the silver market. We would hasten to say that the ‘eruption’ is underway.
The other markets that we identified as highly bullish already left the station. The two raging bull markets are green battery metals with lithium being the outperformer (cobalt, graphite and vanadium have partially broken out so there is still upside potential there), and the dry bulk shipping market.
“Silver, oh silver, when will you do your magic?” is what many are asking. If silver would be able to answer this question it would undoubtedly say “very soon“, and it would add “why don’t you relax, I’ll do the work, you don’t have to work“.
This really brings up a shortcoming of investors. They want to see returns, now. It seems to be tough, mentally, emotionally, for investors to give a market time.
What we do know from history is that the longer a (bullish) consolidation goes on the more powerful its outcome. In a way, as a team of analysts/investors we do hope that consolidations take longer. It’s a disconnect between groups of investors, and those with a short term focus (read: what is my portfolio doing today) will miss the big opportunities that markets have to offer (big trends brewing that will deliver big results in 6 to 12 months).
That said, we couldn’t be more excited about the prospects of the silver market. Silver has an even more powerful chart, according to us. And it is preparing an epic secular breakout.
The daily price chart with the 3 month cycles shows a successful test of the 23 – 24 area. Against last September-December this is a higher low (the two lowest red trendlines were not hit on a daily closing basis), clearly, and that’s is strongly bullish for the long term. Strongly bullish!

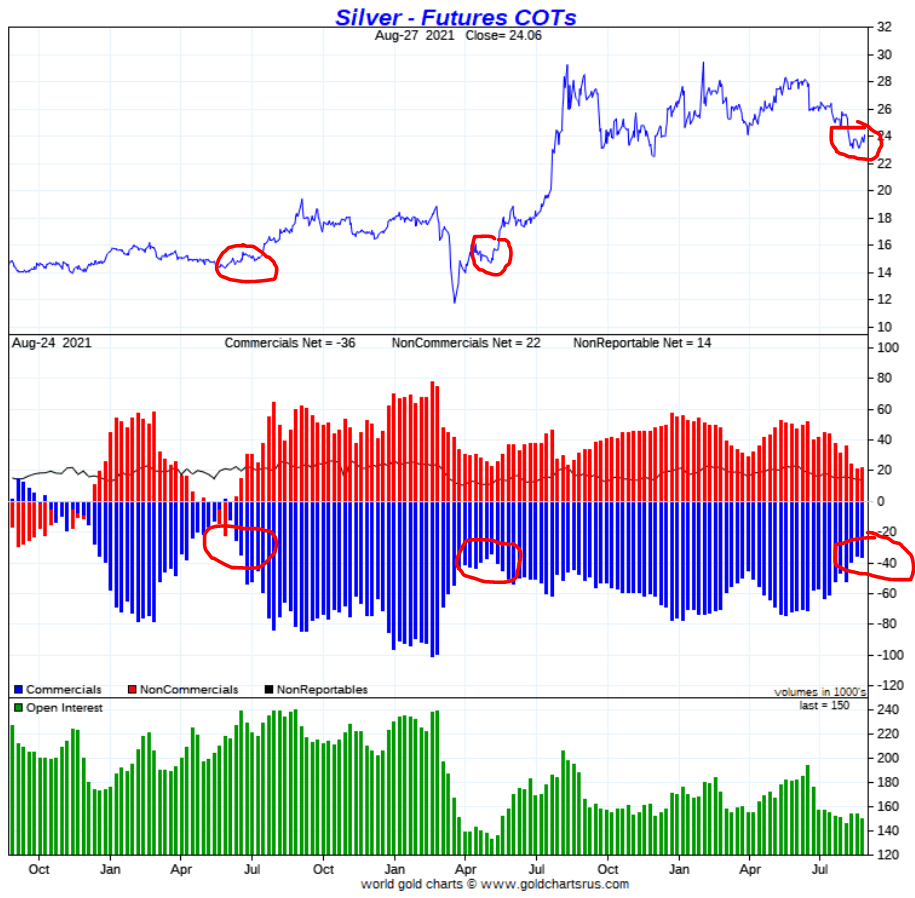
One leading indicator of silver is the futures CoT report (source: Goldchartsrus.com). Think of it as a ‘stretch indicator’: extreme levels of net short positions of commercials, blue bars in the 2nd pane, suggest price has no power to rise. The opposite is true as well. Their net short position currently is as low as in May/June of 2020, and June of 2019. We did indicate on the price chart (first pane) where the silver price was in those 2 other similar points in time so you can verify what subsequently happened with the silver price.
Strongly bullish silver CoT setup.


