We continue to see evidence that our bullish 2023 silver forecast has solid foundations. Yes, the price of silver came down in 2022, yes it created a very bullish reversal structure in doing so. In the end, our bullish silver forecast for 2022 was partially achieved (because of the drop after getting close to our price target in March) but, more importantly, it seems to be postponed (with an even higher price target as a result). Silver and stocks often tend to rise in tandem, that’s why it’s crucial for silver that stocks are mildly to wildly bullish. It’s one of the reasons why we spend a lot of time on our stock market crash analysis, part of our series of 2023 forecasts.
The price of silver is consolidating. In doing so, as said recently the Silver Price Chart Bullish Reversal Structure Is Almost Complete. That’s great news for long term silver investors.
But what does all this mean for silver miners?
We would argue that it’s time for silver mining investors to wake up.
Let’s review the medium term and long term silver mining charts based on the leading ETF which is SIL.
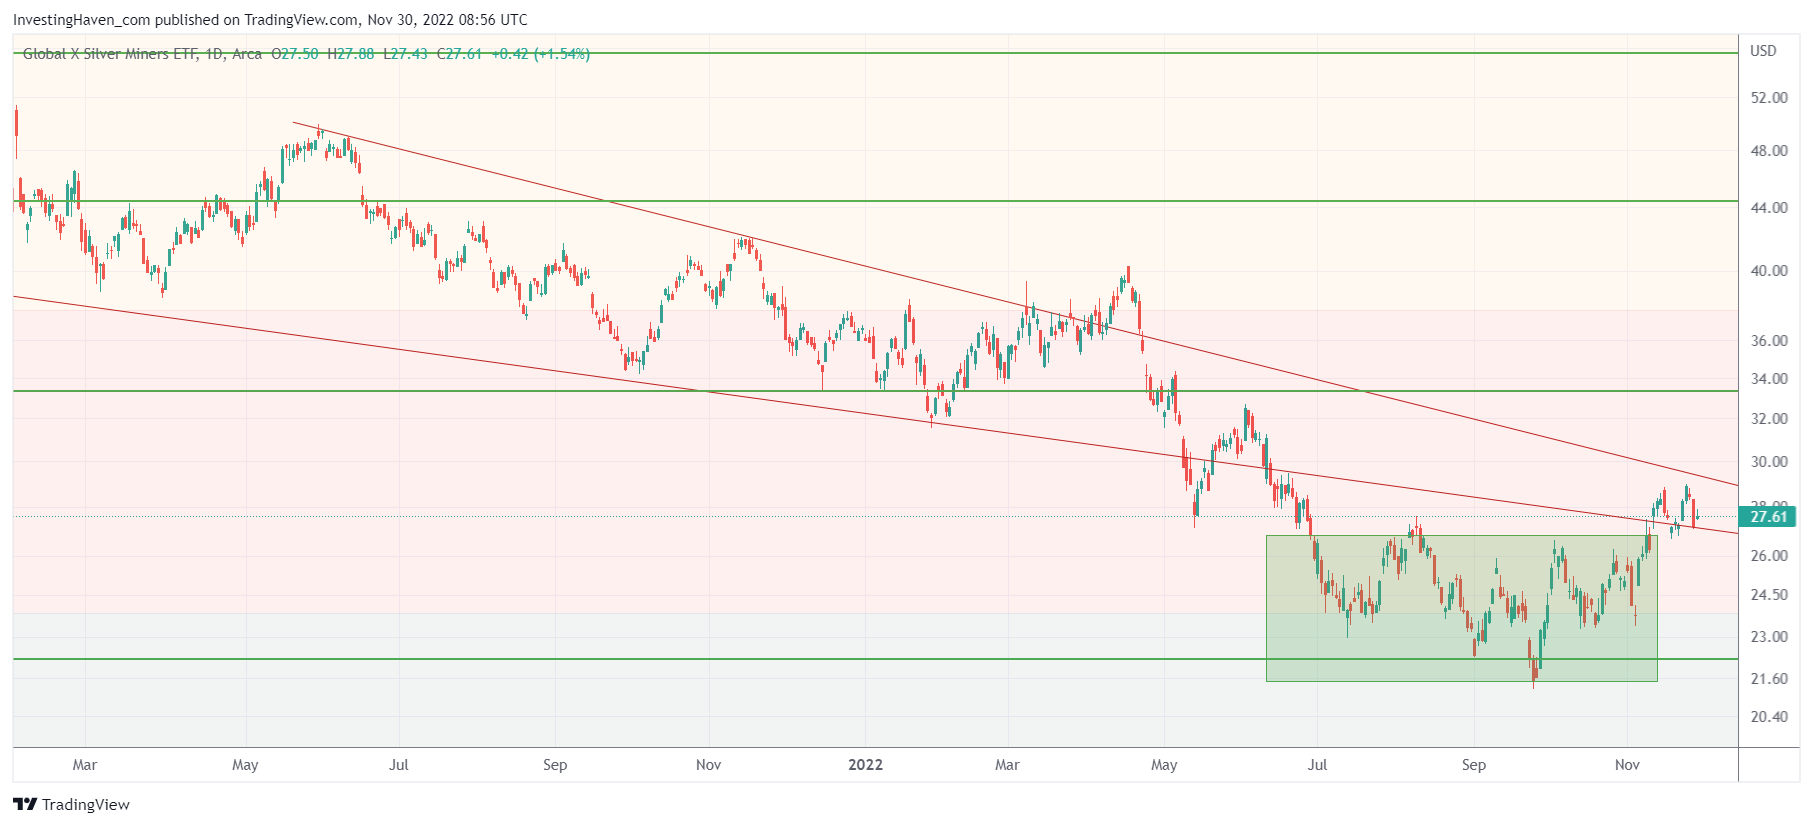
The daily chart which features 18 months of price action is trying to wrap up a bullish reversal that took 6 months to complete. As seen on the first chart, there was a somehow similar bullish reversal structure about a year ago, but it eventually gave up in April/May. That’s because of the pressure on stocks combined with the silver price decline.
The picture looks much better right now, however two critical falling trendlines need to be cleared, as evidenced by our annotations on the chart. This needs time, but not a lot more time. Our estimate is that it will take another few months, not more, before we know for sure that this setup will resolve higher.
In terms of price, we can clearly see that 27-29 is the key area, absolutely key!
It becomes more interesting when we zoom out!
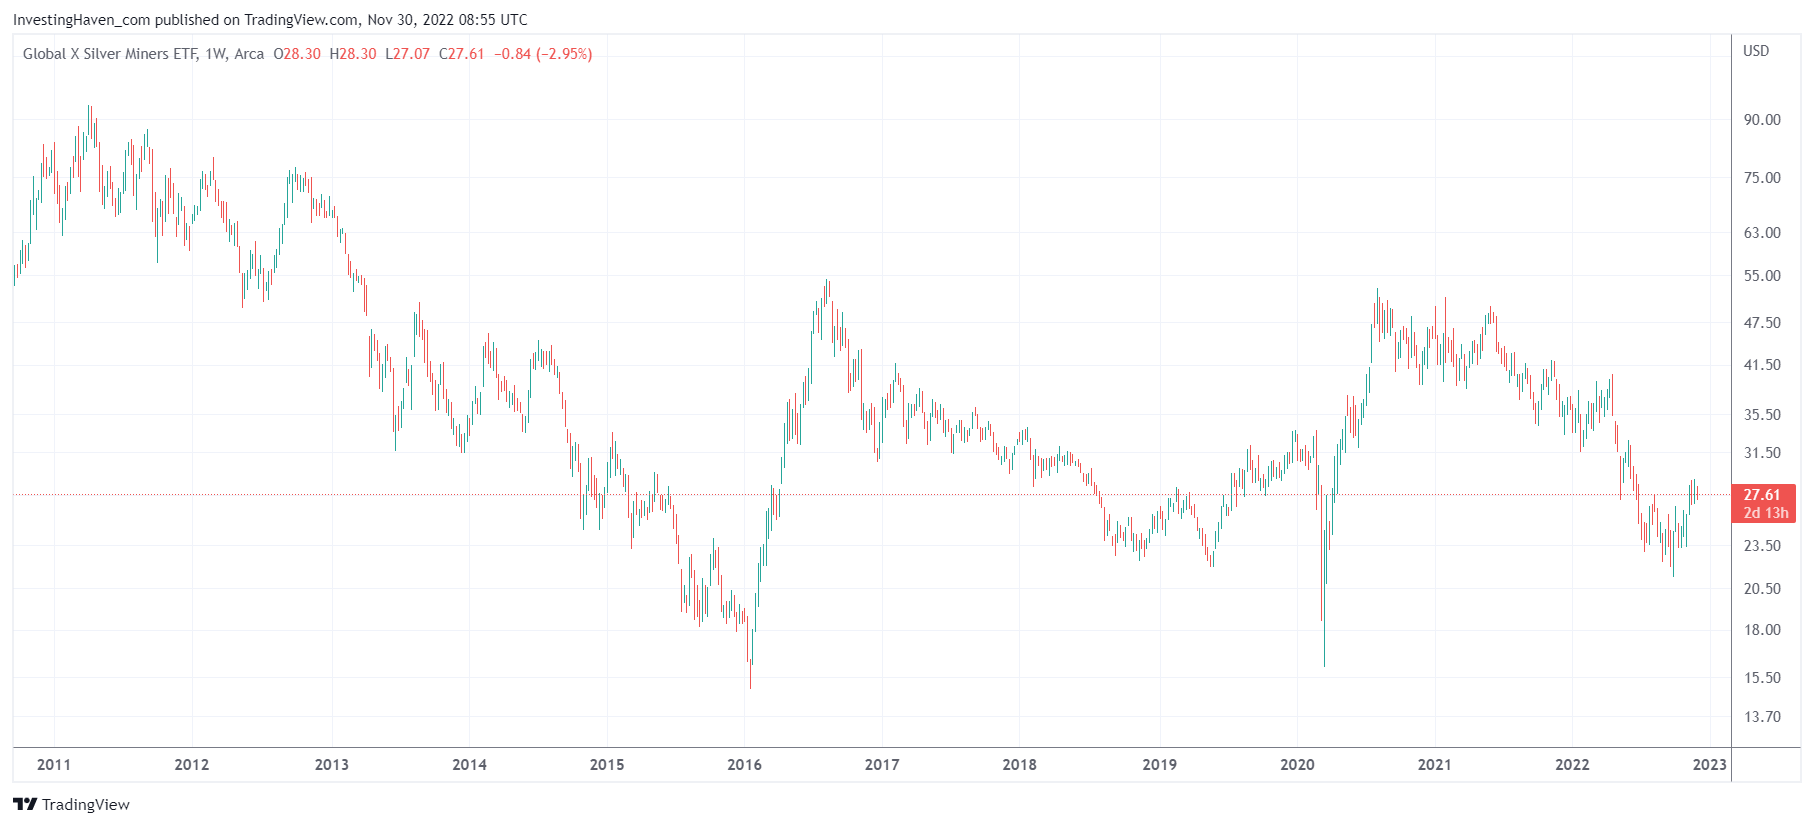
On the weekly chart featuring 11 years of price action we see a huge triple W reversal structure. Equally important, underpinning the wildly bullish potential of this setup, is the current support structure. As seen, the 2018, 2019, 2020 support was respected in 2022. Now THAT is bullish provided the 2022 lows will hold, ideally the 2018/2019 lows should hold.
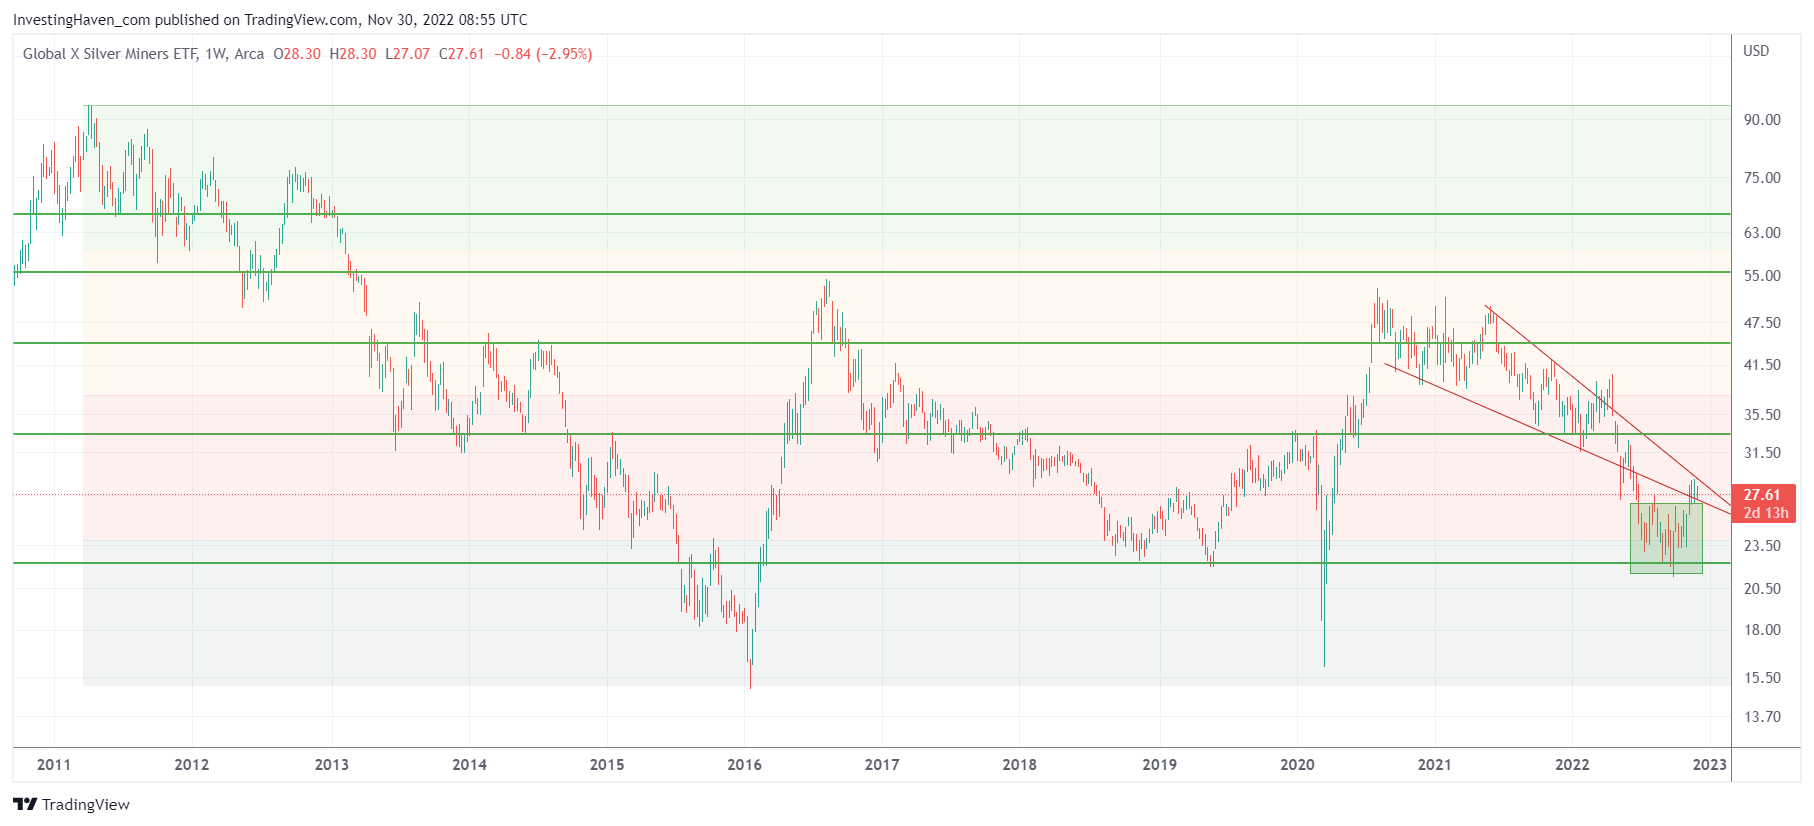
Let’s now overlay our annotations to the previous chart. This is what it looks like:
We can see how key support came in at 22 points and how 32 points will be the first level to clear to turn really bullish. Ultimately, 36 is the real breakout point with 44 points the level that must hold in order to get back to the 60-80 area.


