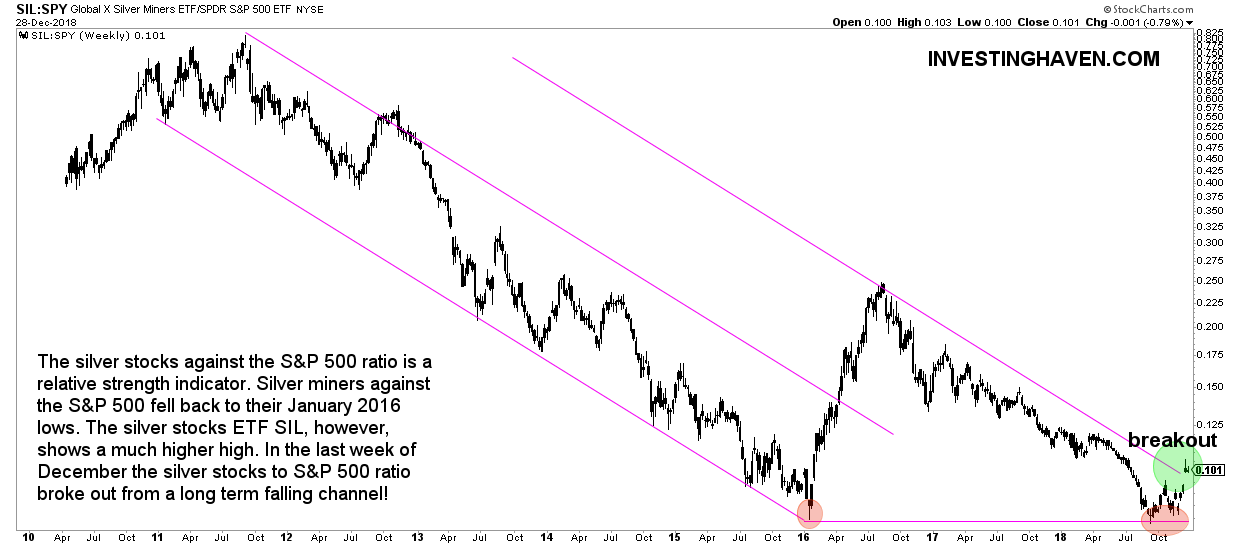
Our silver stocks forecast for 2019 featured a very informative chart: the silver stocks to S&P 500 ratio. This week this ratio broke out after setting a huge double bottom in the last quarter of this year. Driven by a great precious metals outlook which we have detailed in our gold forecast 2019 as well as silver forecast 2019 we see silver miners go much higher in 2019.
Before looking into this awesome chart we have to point that any ratio, including the the silver stocks to S&P 500 ratio, is not a primary or leading indicator. All ratio’s are secondary indicators, meant to provide additional evidence.
The silver stocks to S&P 500 ratio outlined below shows a very bullish outlook for silver stocks especially in the first part of 2019.
What really stands out is this giant double bottom in which the January 2016 lows were re-tested in October-November-December of this year, essentially Q4 of this year. The recent decline bottomed exactly at the same level as the bottom 2.5 years ago.
This should not come as a surprise as broad stock markets driven by indexes like the Russell 2000 and the S&P 500 have experienced a once-in-a-decade sell-off in Q4 of this year. So, intuitively, any ratio against the S&P 500 will improve.
But this is not the key argument for the silver sector. The precious metals space is deeply undervalued is the right take-away from this chart. And, on top of this, with a falling set of broad stock market indexes it makes sense that money flows into deeply undervalued sectors. That’s the right way to read this ratio chart.
As said many times silver is a restless metal. So once it starts rising it goes very hard. We expect the silver miners to be a very profitable trade, and, even if broad markets stabilize the new trend into silver miners has started.


