Surprising but true. Our chart readings tell us that silver has good upside potential despite the recent surge in the silver price. If this is true it may mean that our 2020 silver forecast will be crushed.
Let’s look at the charts to see what we believe is going on in the silver market.
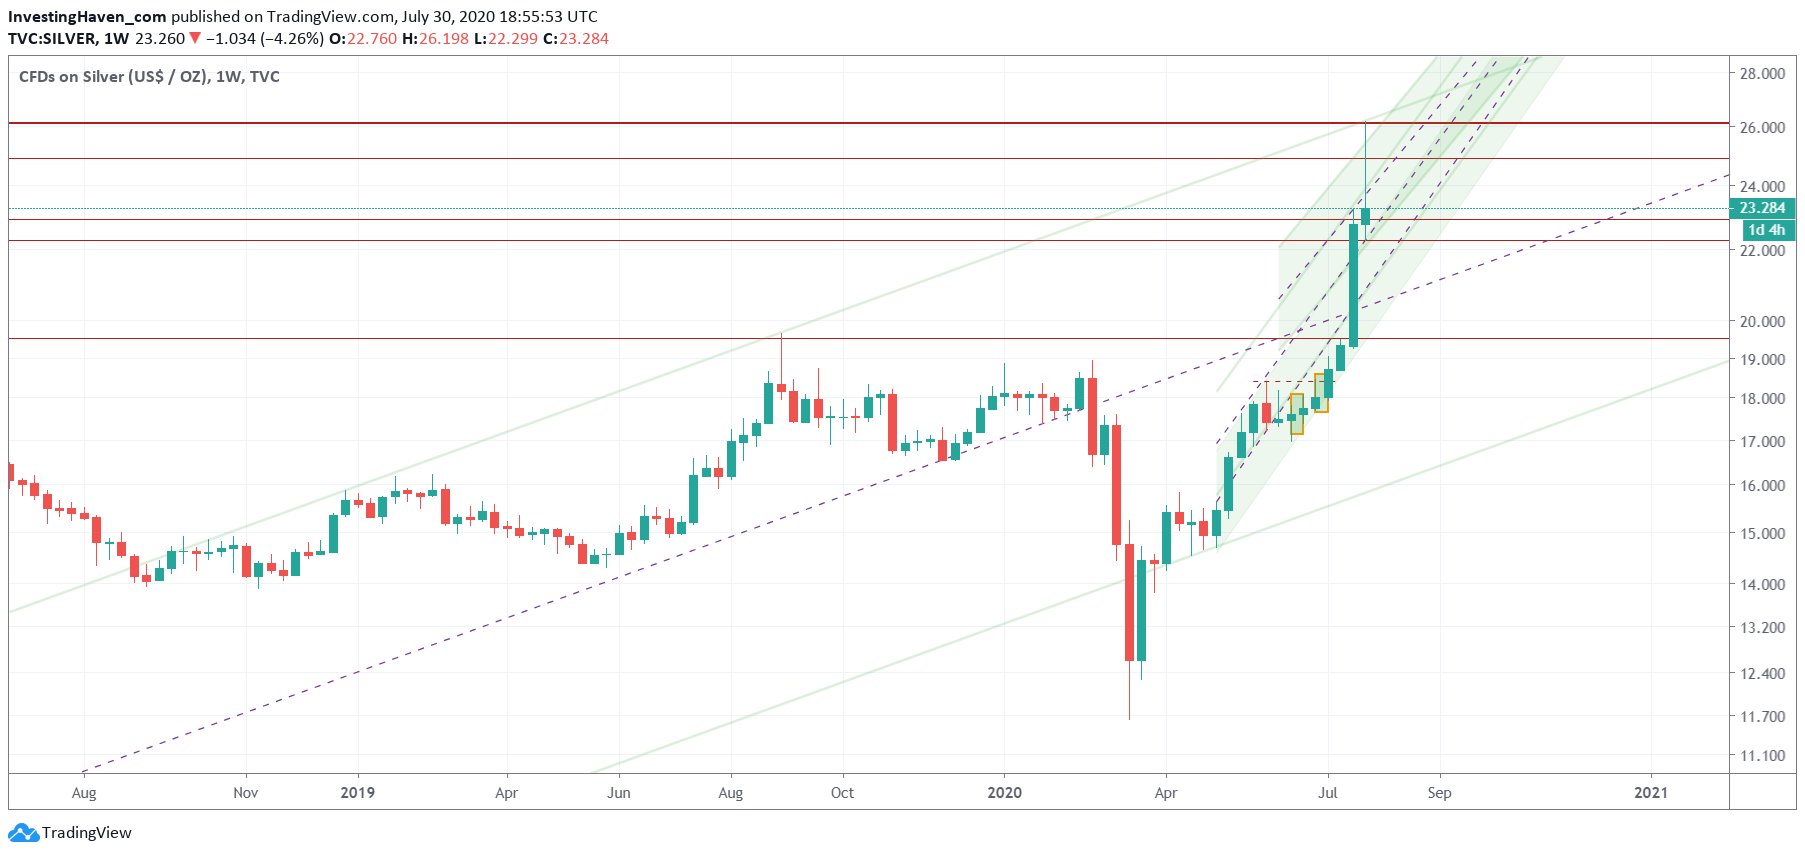
First the weekly silver price chart.
Pretty complex, isn’t it?
It is, the weekly silver chart has a few extremely interesting points:
- There is a solid rising trend which started in 2019 (green channel).
- This rising trend connects the highs of 2019 with the lows of 2020.
- The silver price peak on Tuesday July 28th, 2020 touched the top of the channel. This may suggest silver will go lower before it goes higher. Interestingly, silver dropped 18% (top to down) on that very same day!
- Right now silver is trading about the highs of the long reversal period 2013-2019 (red horizontal lines).
With all that said we believe there is a fair chance that silver is about to consolidate in the 22 to 25 range which might set the stage for the next silver price rally.

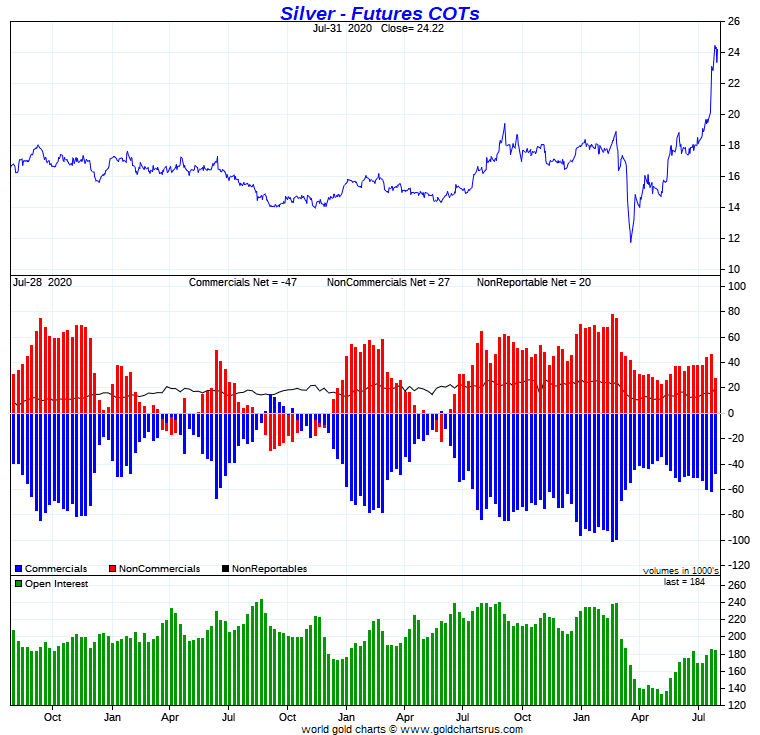
The second chart is the silver COT report (courtsey: Goldchartsrus).
We look at this chart to find extreme readings. Particularly if futures traders hold net positions that are near multi year extremes it implies prices have not a lot of upside/downside (think in the same price trend).
The silver COT report shows anything but extreme readings of market participants. Moreover, open interest is nowhere near extremes.
We believe this suggests that the silver price did not peak yet, there is more upside potential, even though unclear how much exactly and until when exactly.


