Gold stocks were the outperformers in markets last week. Some followers (already) get concerned, and are asking whether it is time to sell gold stocks. This is a common mistake which ‘helps’ investors leave plenty of profits on the table! The most important insight for investors with positions in the gold market is this: the phase of the gold market. To be more precise we are in the initial phase of a new bull market. This is a phase which has enormous upside potential. Don’t forget the Precious Metals Stocks Beautiful Textbook-Alike Breakout In 2019 occurred just a few weeks ago. This is not a time to sell gold stocks, it’s a time to hold strong and only sell in very specific (exceptional) conditions. All signs are on ‘green’ that our $1550 gold forecast is underway and that top gold stocks will do very well. Notably, our top silver pick with our forecast explained in First Majestic Silver has even more upside potential. Nothing changed
Again, the big mistake to make in this market is to sell too early.
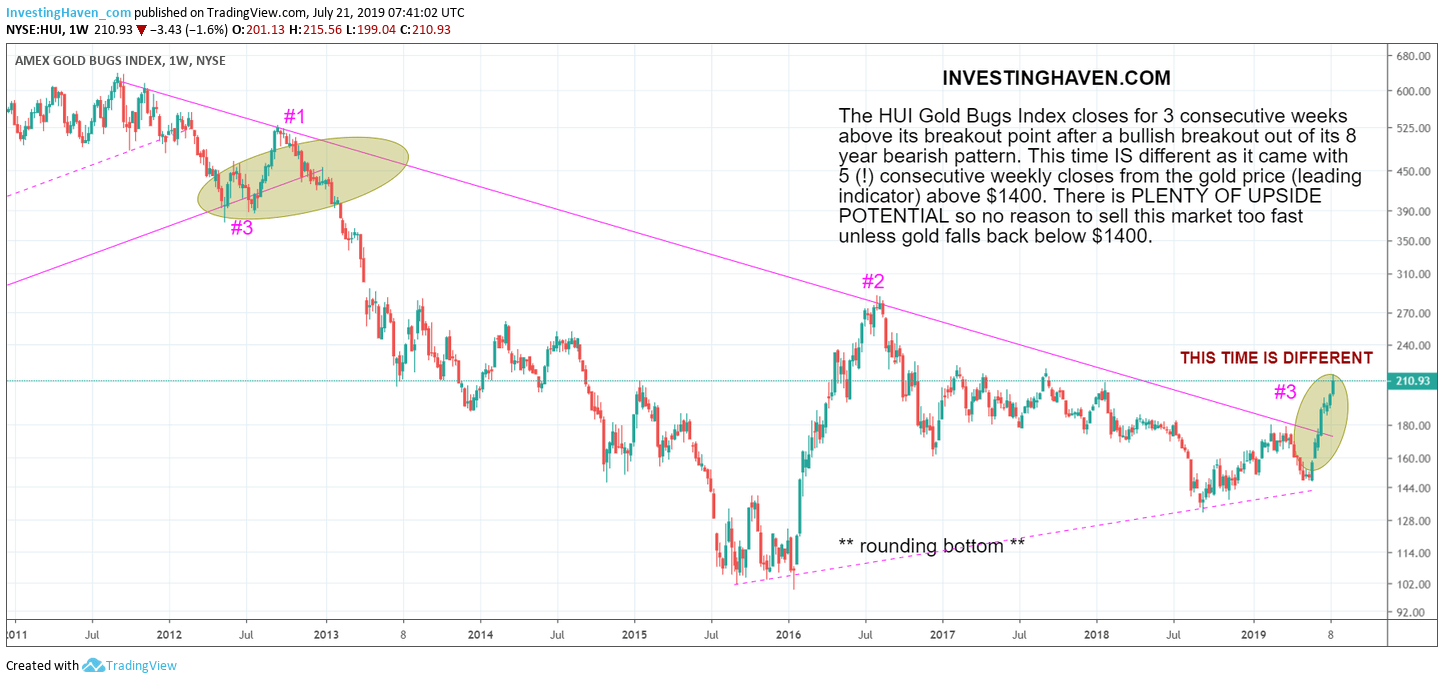
In order to visualize this we include the weekly chart of the HUI Gold Bugs, a leading gold stock index in existence for several decades.
The pattern we see is the major top in 2011, the violent bear market which ended in June of 2019, and the start of the new bull market.
Anyone able to spot the upside potential?
The first moment to really start getting potentially cautious is once the HUI index touches 270 points. That’s still 30% to go, and top performers like First Majestic Silver will largely outperform this index. We believe by then First Majestic Silver will have doubled, exactly as predicted last year. That may indeed become the first moment to start taking profits.

There is one, and only one, situation that will make us concerned.
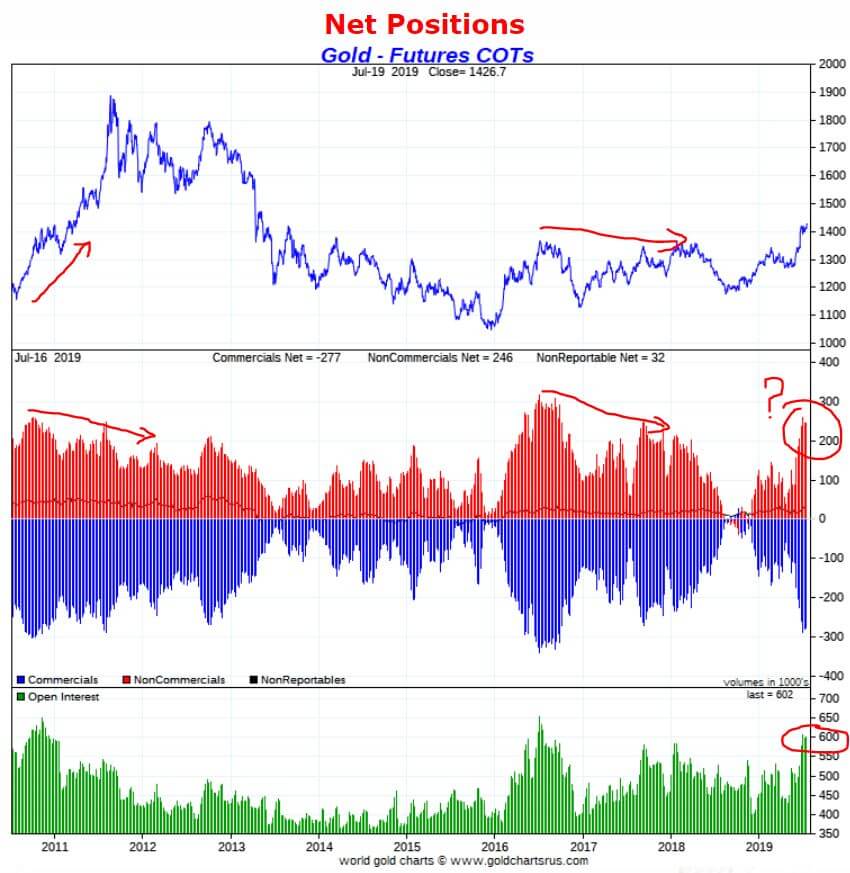
Below is one of the 3 leading indicators for the gold price itself. Courtesy of Goldchartsrus.com.
The net positions in the gold futures market of noncommercials is the indicator we are interested in. We refer to our gold forecast 2019 for details on how to read this chart.
As seen in the last 10 years any bull market will push price higher on lower net long positions of noncommercials. Case in point 2011.
The opposite is true is well: a bear market rise will not allow gold prices to rise even though net long positions decrease. Case in point 2017.
The evolution of this chart will tell us whether we are indeed in a new bull market. What we want to see is higher gold price tops which come with lower net long positions of noncommercial traders. If this pattern would not happen the current rise in the precious metals market, notably gold stocks, might be short-lived.

[Ed. note: As of this week we will provide in-depth analysis to our ‘free newsletter’ subscribers. We will bring premium content with specific (gold and silver) investing tips on a weekly basis, mid-week, free of charge. We will do this for 4 months. Subscribe to our free newsletter and get premium (gold and silver) investing insights in 2019 for free. Sign up >> ]


