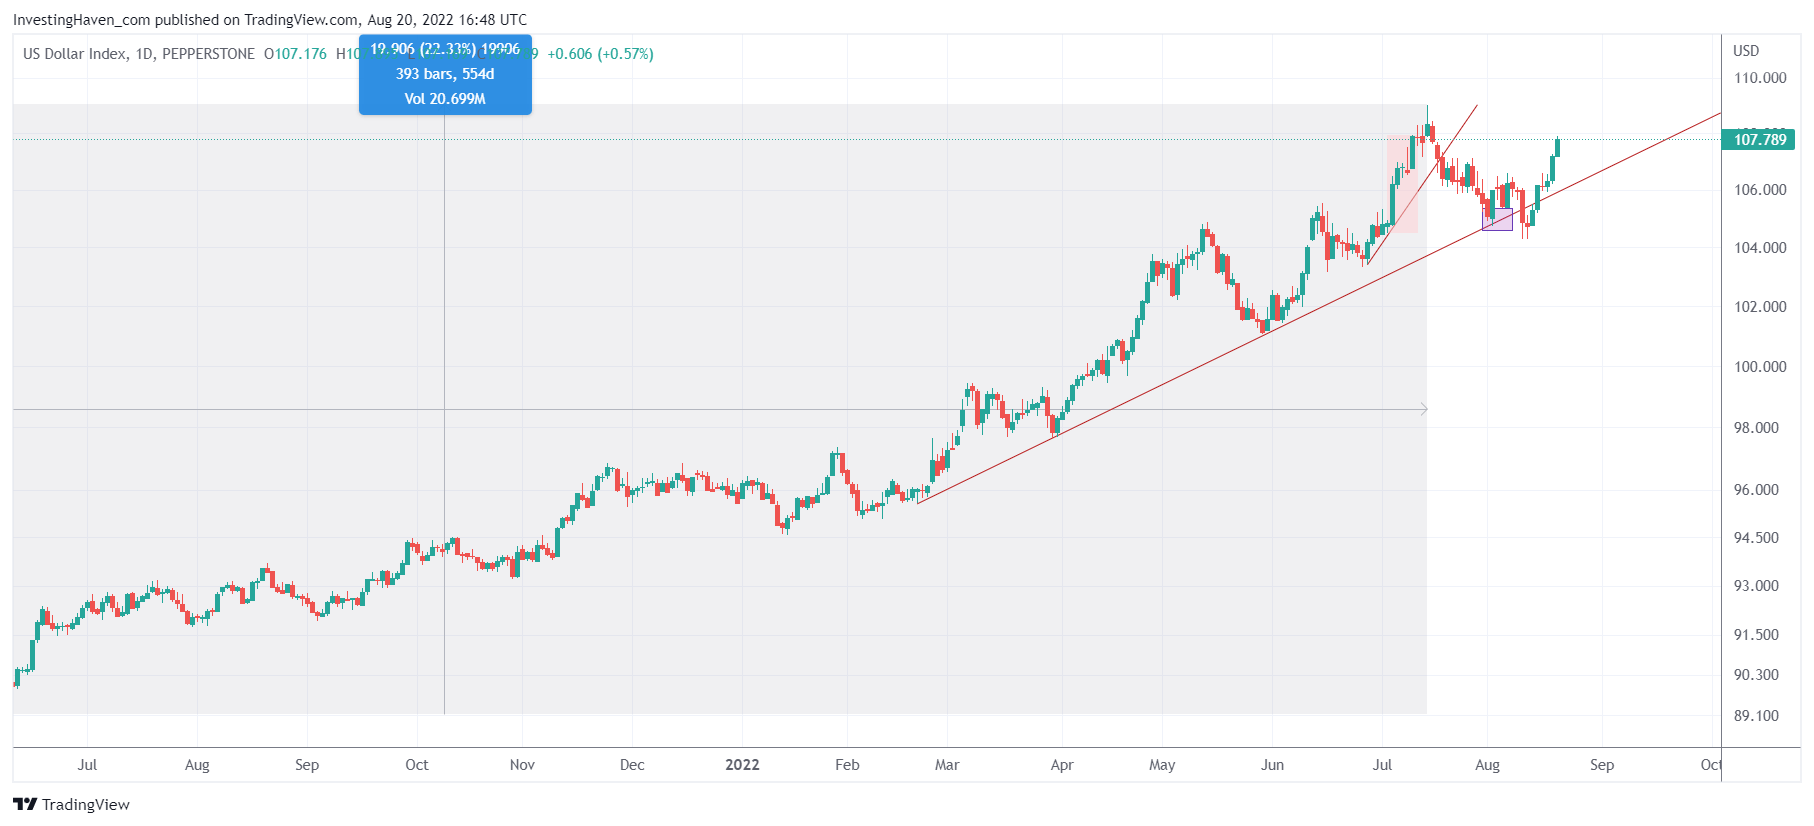
The U.S. Dollar had a really strong week. It hit resistance early July and started forming a Bearish Pattern On the US Dollar Chart around July 20th. Three weeks later and the USD is back in the game. Commodities had a rough week, metals had a rough week, copper was probably the only exception last week (after it came down drastically in recent months). Will the USD continue to impact commodities, is one of the questions top of mind of investors.
As always, we try to answer questions like the one outlined above based on chart findings.
As explained in 100 Investing Tips for Investors, we ‘start with the chart’.
The US Dollar chart slowed down its uptrend and was violating its 2022 rising trend(line). As seen on the chart, the ‘breakdown’ qualified as a bear trap. The USD closed for 3 days below its rising trendline but on day #4 it was back above it. The 109 level is the first logic target.
If anything, the USD created serious resistance around 109 points in the 2nd week of July for reasons explained in great detail in our research. The question is on which timeframe
So far the short to medium term findings.
What we need is a longer term chart to understand what the recent USD turning point (at 107.72 points) means in the bigger scheme of things.
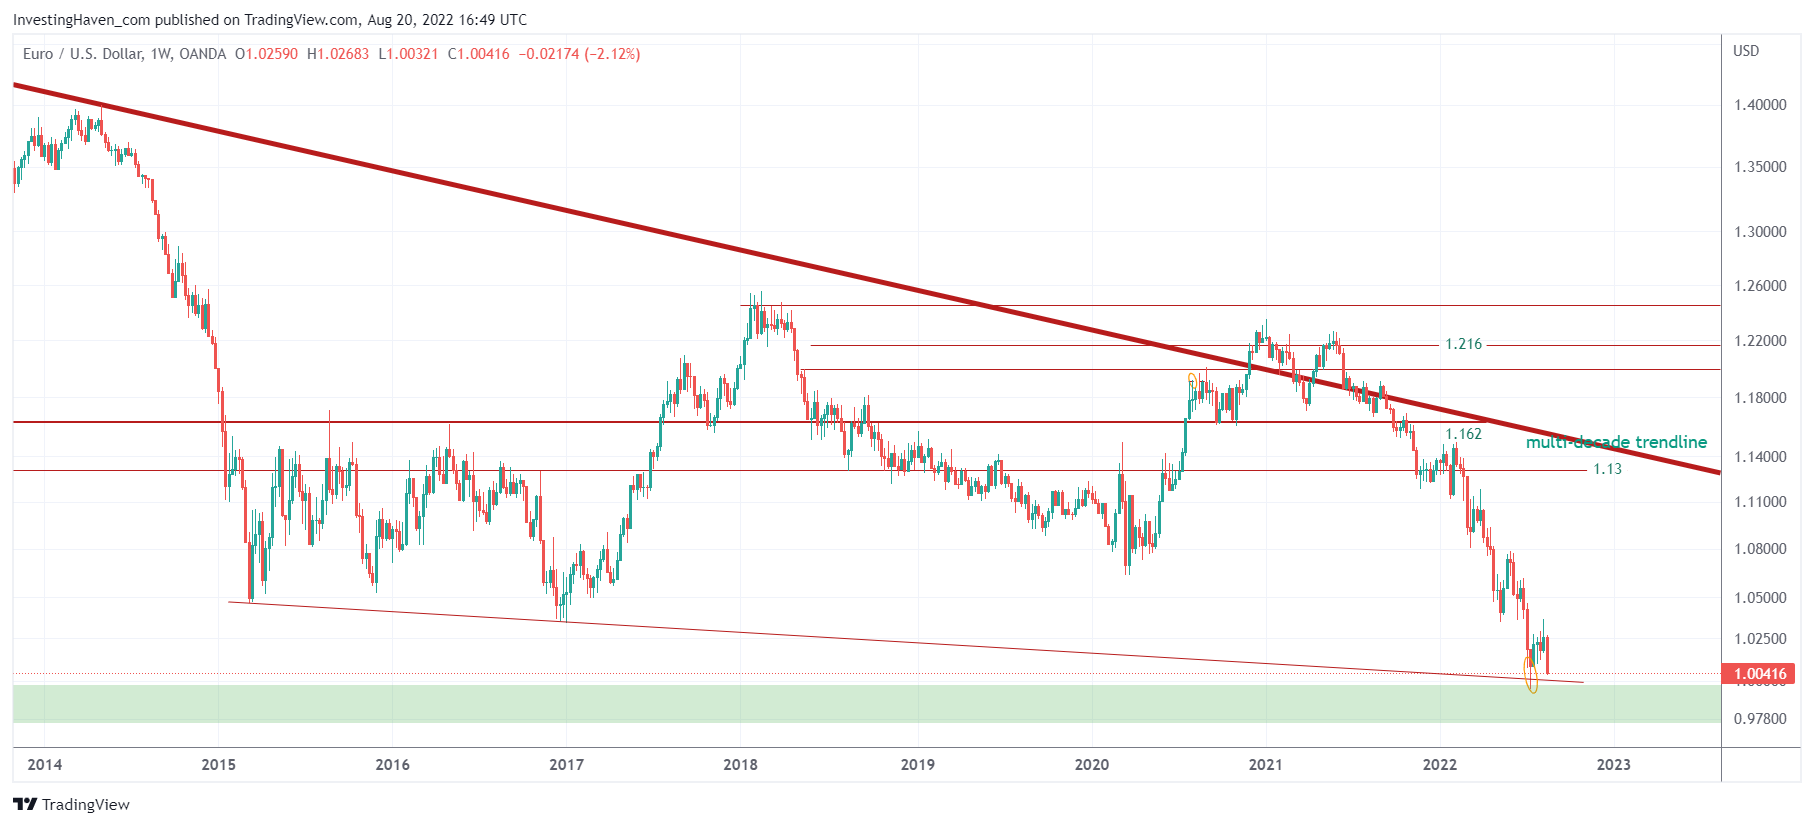
We want to ‘flip the view’ and look at the Euro chart instead. We explained in the past that the Euro chart often comes with better insights.
Below is the long term Euro chart, weekly timeframe. The falling trendline which connects the lows of 2015 and 2016 with the lows of 2022. A test of parity is underway, this will coincide with 109 points in the USD.
In a way, this chart does not really help us with new insights as it relates to turning points and support/resistance of the USD. What we can see, however, is the critical nature of the price levels that are about to be tested: 109 points in the USD index and parity of the Eurusd pair.
What does all this mean for commodities?
If anything, the USD trend in recent months clearly invalidated the idea of a lasting and broad based commodities rally. We are most likely entering a bi-furcated commodities trend. We expect the commodities universe to exhibit bullish, bearish and neutral trends.
Although we cannot be more specific at this point in time, we believe that a diversified commodities-only investing strategy is not going to be profitable. We still see some commodities outperform the market, think special metals (silver is part of this group although it is now suffering because of its precious metals function). Lithium is the leader.
For now, we prefer to watch how the market will react to the USD index at 109 points and the EURUSD near parity. We want to focus on candle structures of 3 to 5 days. Even if the USD index will clear 109 points, we believe 111 will be the next big resistance level.
In the meantime, we focus on the impact of USD strength on individual commodities.
So, in sum, we believe this is not a time to be forecasting but to be observing. There are times when forecasting works well, there are also times when observing is required (which ultimately will lead to better forecasts).


