
Hyperliquid (HYPE) is rebounding strongly after a 40% drop, fueled by solid technicals, record volumes, and whale accumulation. Traders eye a breakout toward $50, but watch key support at $40.
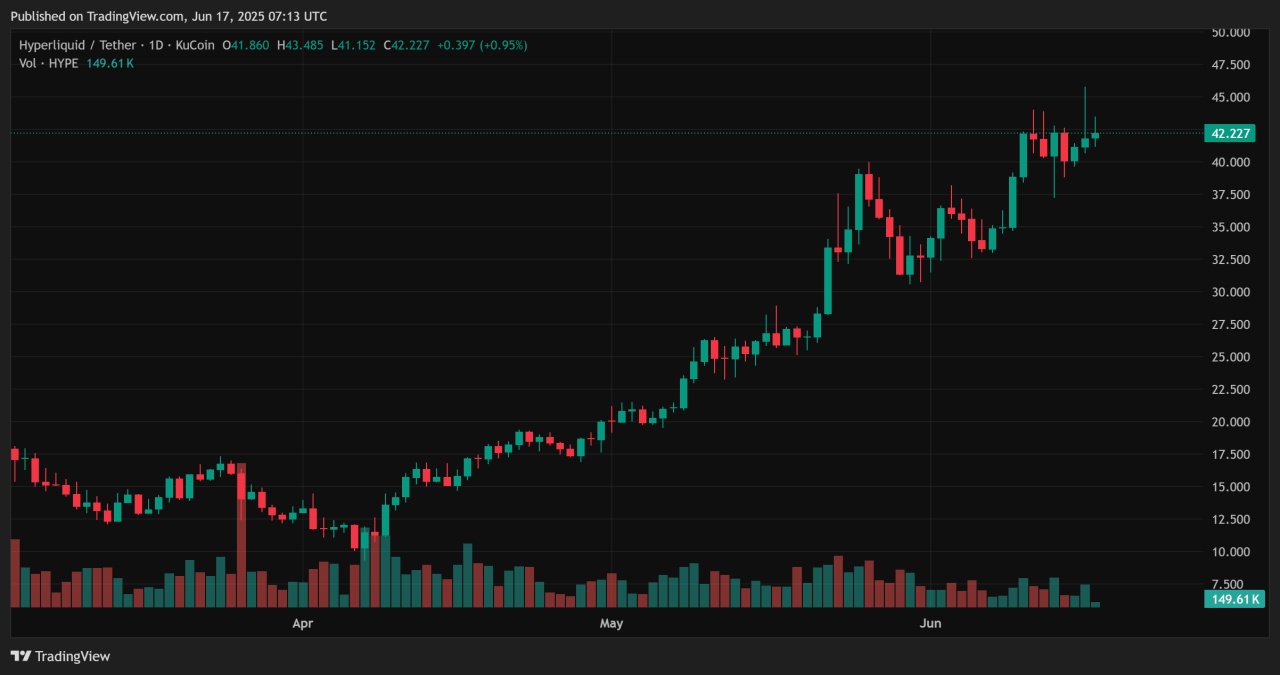
After plummeting roughly 40% from its December high, Hyperliquid (HYPE) has exploded back into the spotlight—up nearly 200% in the past two months and hitting a record $44.69 as of June 16.
With momentum building, the question today is: are we witnessing a genuine breakout or the top of a parabolic move?
Technical Rebound & Momentum
HYPE’s rebound is technically compelling. Having surged above critical resistance at $35.13–$36, it recently pierced patterns like bullish pennants and wedge formations—classic continuation signals.
Oscillators reinforce the bullish thesis: MACD is positive, RSI remains elevated yet not extreme, and Chaikin Money Flow shows strong capital inflows.
Still, long-liquidation “cliffs” loom near $36–$40, where over $3 million in long positions could be wiped out.
Fundamentals & On‑Chain Catalysts
On-chain metrics spotlight its dominance. Hyperliquid now ranks as the fifth-largest decentralized perpetuals exchange, processing daily volumes of $10–11 billion and sustaining over $1.9 billion in open interest.
Its TVL has rocketed to ~$2.5–3.2 billion—a more than 80% jump in 30 days—while USDC inflows topped $1 billion and protocol revenues reached ~$12.8 million weekly, even outpacing Ethereum per revenue basis.
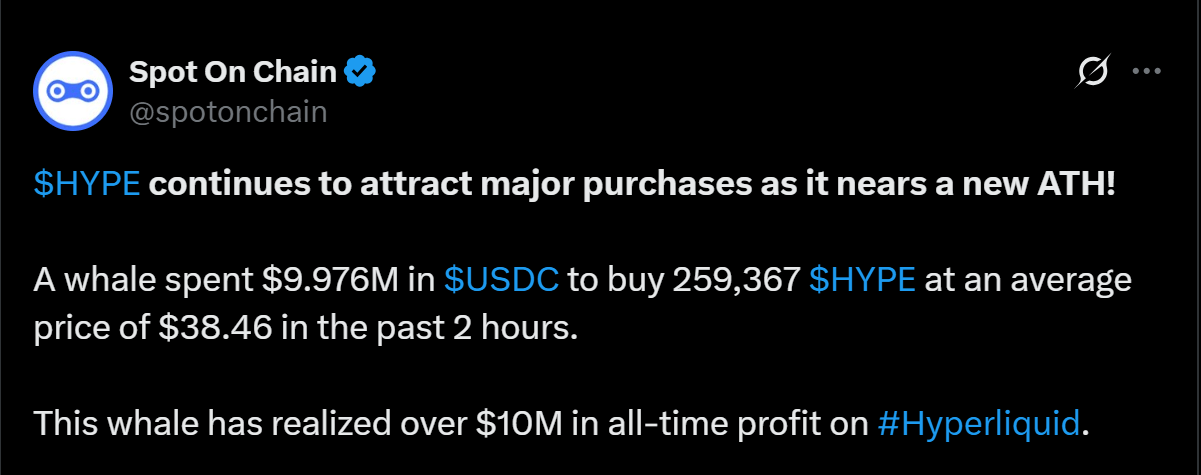
Whales are actively accumulating—one whale’s nearly $10 million purchase at ~$38.50 drove the token past $40.
Near‑Term Prediction
Expect resistance at $44.7–45, with a likely breakout scenario targeting $50 next—potentially reaching $55 on Fibonacci momentum.
If support zones ($40–36) fail, however, a retrace toward $30–32 becomes probable, aligning with prior Fibonacci corrections .
Conclusion
HYPE has rallied back from its steep 40% slide, showing strong technical setups, skyrocketing ecosystem activity, whale buying, and robust revenue trends.
While the risk of a pullback remains if it breaks below $40, current indicators support a breakout toward $50+. For risk-tolerant traders, the upside potential outweighs short-term corrections—just size positions wisely.
Best Crypto Exchange for Intermediate Traders and Investors

Invest in cryptocurrencies and 3,000+ other assets including stocks and precious metals.
0% commission on stocks - buy in bulk or just a fraction from as little as $10. Other fees apply. For more information, visit etoro.com/trading/fees.
Copy top-performing traders in real time, automatically.
eToro USA is registered with FINRA for securities trading.
30+ million
Users worldwide
Our latest crypto alerts – instantly accessible
This is how we are guiding our premium members (log in required):
- The Alt Season Charts (June 15th)
- Another Test of 106.1k, Is This THE Big One? (June 8th)
- How Much Longer Do We Have To Wait For Alt Season 2025? (June 1st)
- The Bitcoin vs. Altcoin Divergence (May 24th)
- Is A Massive Breakout Coming? (May 17th)
- Top Altcoin Picks in the Strongest Emerging Narrative (May 9th)
- Bitcoin’s Must-Watch Chart Structure, What It Means For Top Altcoins (May 6th)


