Investing Haven
No Result
View All Result
Gold Silver Investing >>
CRYPTO INVESTING >>
  • 2025 Forecasts
    • 10 market predictions
    • Dow Jones forecast
    • S&P 500 forecast 2025
    • Nasdaq prediction 2025
    • Best altcoins to buy
    • Best crypto to buy now
    • Which crypto will explode
    • 15 crypto forecasts 2025
    • Which precious metal to buy
  • Silver
    • Silver prediction 2025 – 2030
    • Will silver exceed $30?
    • When will silver hit $50?
    • Can silver hit $100?
    • Silver shortage
    • 50-year silver chart
    • Silver bullish reversal
    • Silver seasonality charts
    • How to invest in silver
  • Gold
    • Gold prediction 2025 – 2030
    • Will gold set new ATH?
    • Will gold hit $3,000?
    • Can gold hit $10,000?
    • Gold chart 10 years
    • Gold chart 50 years
    • Gold chart 100 years
    • Gold silver ratio
    • Gold seasonality charts
  • Commodities
    • Coffee forecasts
    • Sugar forecasts
    • Nickel forecasts
    • Lithium investing
  • Crypto forecasts
    • BTC prediction 2025 – 2030
    • ETH prediction 2025 – 2030
    • SOL prediction 2025 – 2030
    • XRP prediction 2025 – 2030
    • XLM prediction 2025 – 2030
    • BNB prediction 2025 – 2030
    • ADA prediction 2025 – 2030
    • AVAX prediction 2025 – 2030
    • KAS prediction 2025 – 2030
    • NEAR prediction 2025 – 2030
    • BCH prediction 2025 – 2030
    • LINK prediction 2025 – 2030
    • DOT prediction 2025 – 2030
    • SUI prediction 2025 – 2030
    • ICP prediction 2025 – 2030
    • LTC prediction 2025 – 2026
    • STX prediction 2025 – 2030
    • DOGE prediction 2025 – 2030
    • SHIB prediction 2025 – 2030
    • PEPE prediction 2025 – 2030
    • FLOKI prediction 2025 – 2030
    • WIF prediction 2025 – 2030
    • ONDO prediction 2025 – 2030
  • News
    • Crypto news
    • Commodities
  • Login
Investing Haven
No Result
View All Result

Home » Crypto & Blockchain » Bitcoin’s (BTC) 200-Day Moving Average Drops for the First Time in 640 Days. Should Investors Worry?

Bitcoin’s (BTC) 200-Day Moving Average Drops for the First Time in 640 Days. Should Investors Worry?

Bitcoin's 200-day moving average has been point higher since Jan 1st, 2023. It started dropping yesterday.

Taki T. by Taki T.
October 2, 2024
in Crypto & Blockchain
bitcoin price down
2.1k
VIEWS
Share on FacebookShare on Twitter

How concerning is the fact that Bitcoin’s 200 day-moving average (dma) is pointing lower for the first time since 640 days? It’s a concern, for sure, and chart analysis helps understand concern vs. opportunity.

RELATED – Bitcoin’s 2025 price prediction

As explained in (BTC) Below Its 200 Day Moving Average, This One Chart Is Much More Important, we covered the 200 dma recently. We also highlighted the fact that intermarket relationships, i.e. Bitcoin vs. the Nasdaq, is a much more important data point to consider. With this in mind, we’ll still focus on BTC charts in this post but we acknowledge that it’s only part of the story.

Bitcoin’s (BTC) 200-day moving average now dropping

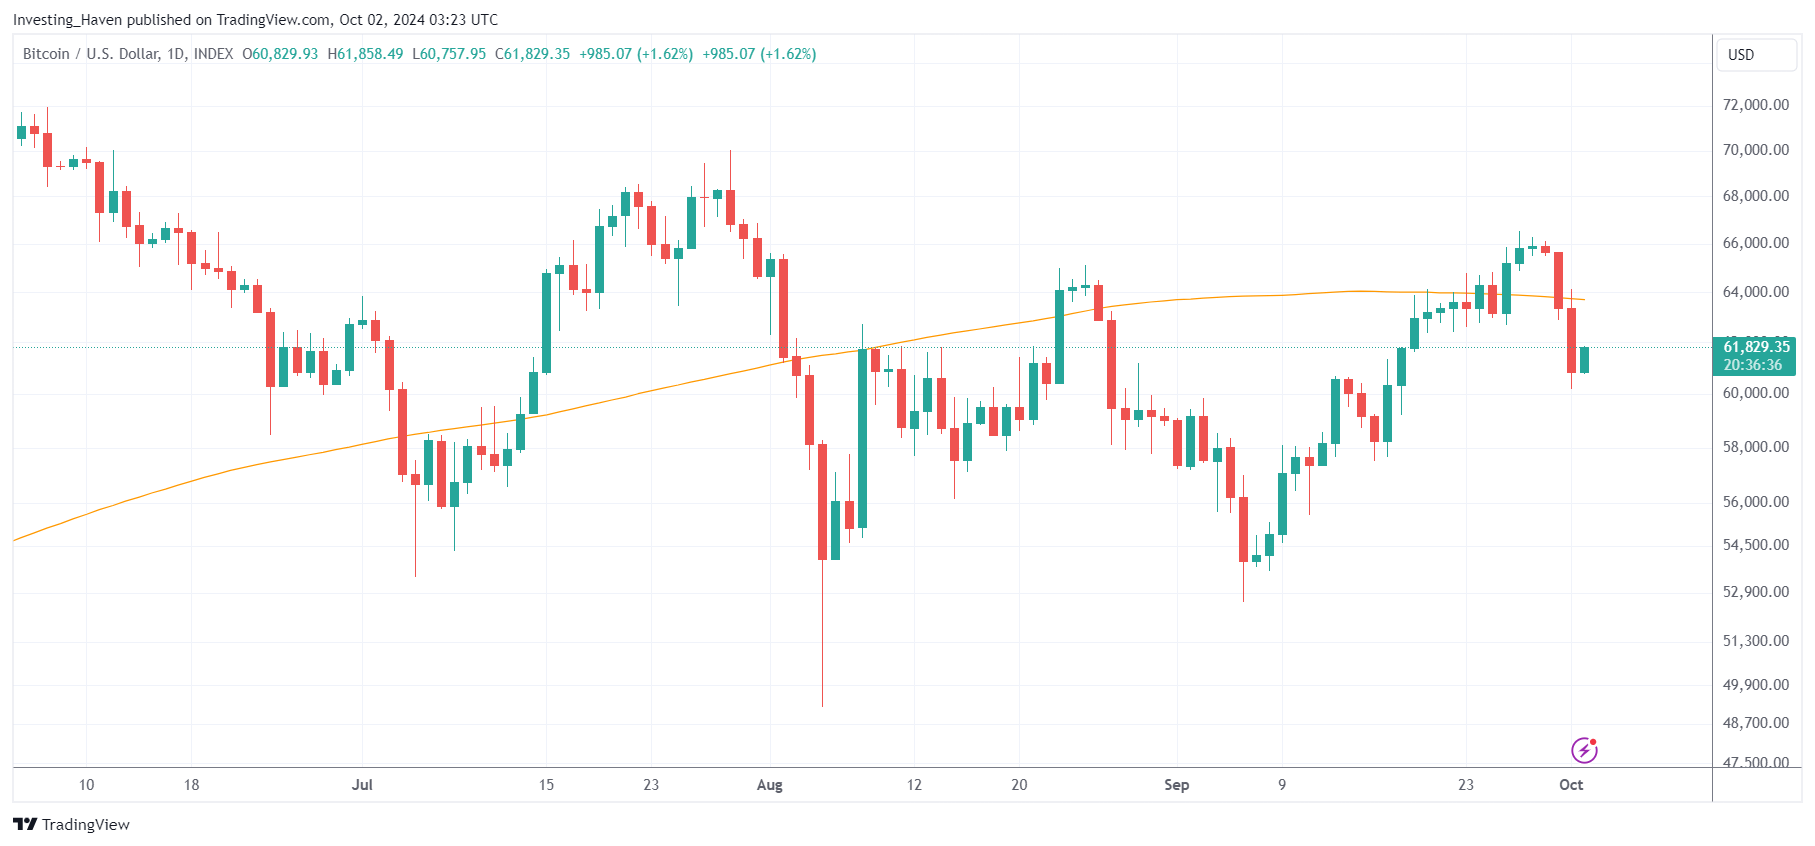
First things first, we visualize the Bitcoin price chart and its 200 dma.

As seen below, on the close-up of Bitcoin’s daily price chart, Bitcoin’s 200 dma has been flat since mid-September.

Since October 1st, 2024, Bitcoin’s 200 dma is starting to point lower.

It’s the start of a period that may last days, weeks, months, we cannot know purely based on a technical indicator like a moving average.

That’s also our criticism with technical indicators – they are lagging. They may flag a potential concern, but that’s as far as they can go.

The only solution to this problem is complementing technical analysis (which is what moving averages belong to) with forward looking techniques from (our) chart analysis.

BTC 200-day moving average
BTC 200-day moving average pointing lower since October 1st, 2024

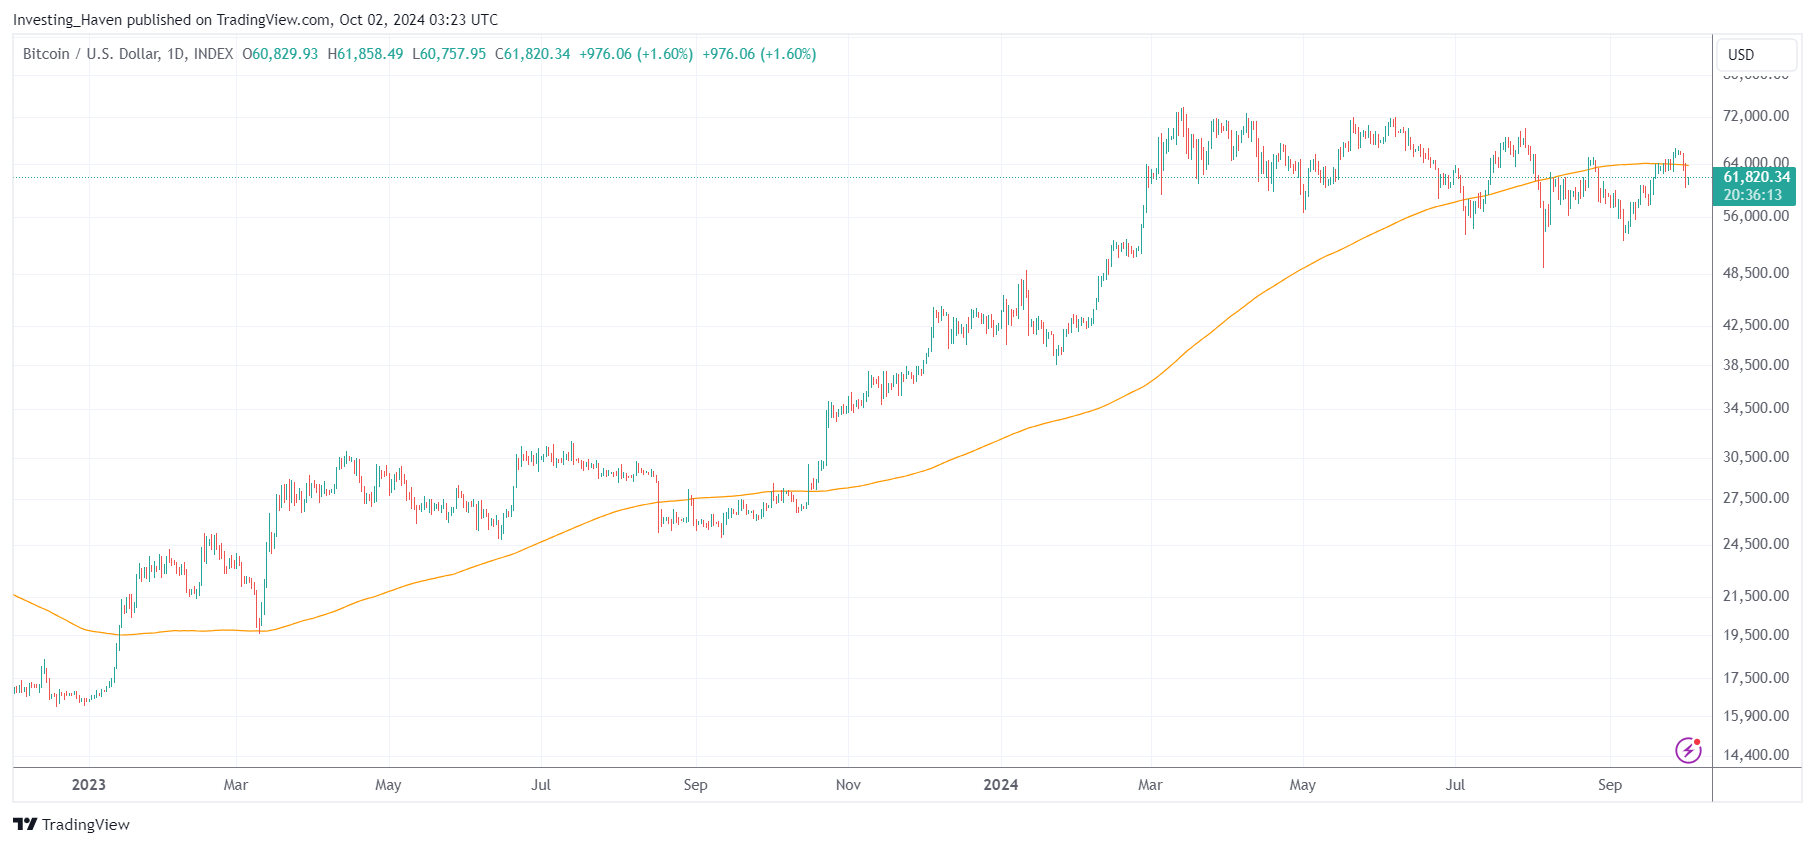
Bitcoin’s 200 dma in the last 640 days

Before looking at chart analysis, we have to show the greatness of Bitcoin’s phenomenal rise in the last 640 days.

The last day that Bitcoin’s 200 dma was falling was Jan 1st, 2023, exactly 640 days ago.

Since then, the 200 dma is either flat (January & February of 2023) or rising (slowly to strongly).

A break is a natural thing, and Bitcoin deserves a break without any doubt. Why not simply allow the market to figure out what’s next, and be patient?

Make no mistake – patience is not what you’ll exercise when tracking the $BTC cash tag on X, on the contrary – BTC posts like this one with a very short term oriented focus will make you feel act which is the worst thing to do as Bitcoin’s 200 dma starts falling.

Bitcoin's 200-day moving average up for 640 days
Bitcoin’s 200-day moving average was up for 640 days

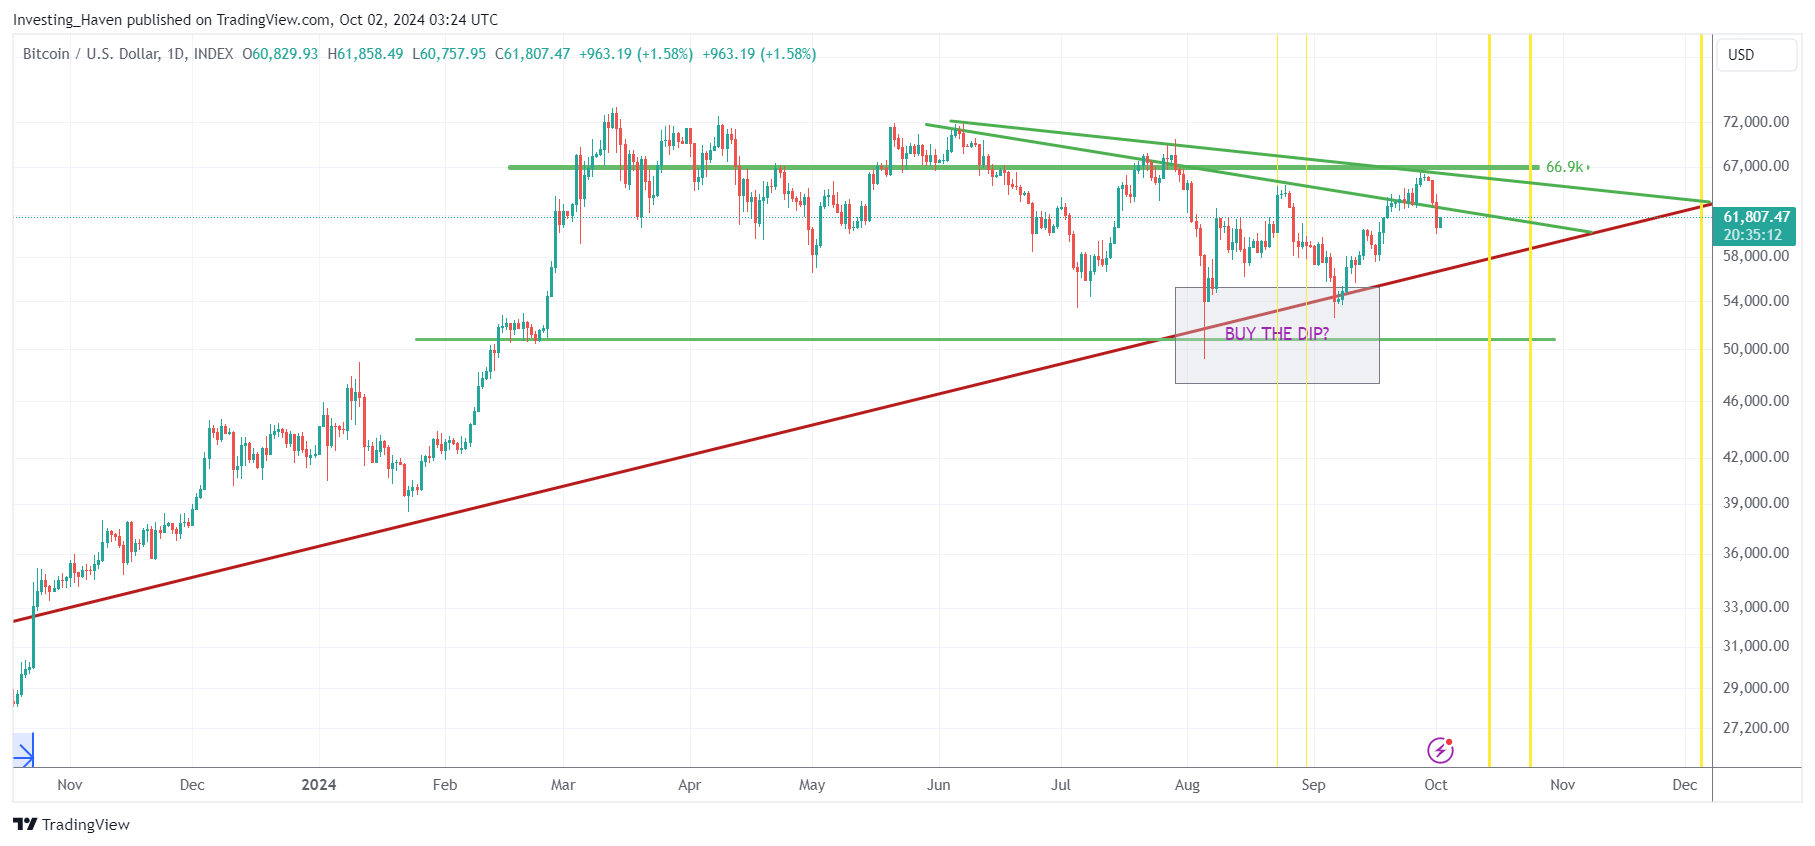
Bitcoin’s (BTC) chart structure

Now, let’s add chart analysis to understand what’s next.

As said, technical analysis (which is what moving average analysis is all about) does not give you any clue about the future. That’s because technical analysis (often referred to as TA) is lagging.

Case in point – when Bitcoin’s 200 dma was flat, in Jan & Feb of 2023, Bitcoin started a strong rally, on a flat 200 dma. Following moving averages would have given you the false perception that Bitcoin will be flat. On Jan 7th, 2023, we flashed strong buy alerts on AI-tokens in our premium crypto research service, two days before they took off like a rocket (10x on some of them), which shows the power of chart analysis compared to TA.

It makes you think why InvestingHaven decided to post this article on the same day Bitcoin’s 200 dma started pointing lower Which Cryptocurrencies Will Be Explosive in 2025? – there is certainly a good reason for the timing of our article.

That said, the BTC chart structure looks not that bad to be honest.

There is one, and only thing to watch out for on Bitcoin’s chart – the long term rising trendline must be respected – in no way should Bitcoin breach the rising trendline (in red on our chart).

In fact, the BTC chart is self-explanatory. The chart structure that it created since June 2024 suggests this:

  • Best case: BTC moves in this triangle pattern, before breaking out in December or January.
  • Base case: BTC drops below the rising trendline, but not for more than 3, 5, 8 days (Fibonacci numbers).
  • Worst case: BTC drops below the rising trendline, and starts a downtrend, triggered by its dropping 200 dma.

In which camp are we? In-between the base case and best case. But we’ll stick to our chart analysis to find out, as the market evolves, which scenario will be unfolding.

Bitcoin BTC chart analysis
Bitcoin (BTC) chart analysis for Oct through Dec 2024

How concerned should crypto investors be?

We believe crypto investors should take the first drop in Bitcoin’s 200 dma seriously.

It’s not a sign that it will crash, on the contrary, the falling dma may stay flat with a slight bearish basis after which it recovers in a few weeks or months. However, it might also stay flat for longer.

All that matters is this – how will BTC behave as it relates to its chart structure shown on our last BTC chart.

It’s truly the only thing that matters combined with segment specific behavior of altcoins.

We track BTC charts for our premium members and provide more detail than what is provided in this blog post. You too may want to follow our premium crypto work.

10-YEAR ANNIVERSARY OFFER: InvestingHaven.com celebrates 10 years. Temporarily, you can enjoy a discount on our premium gold/silver and crypto reports. Or you can become a VIP member. Go to our anniversary deals >>
Receive our FREE crypto predictions alerts

Download 50 crypto investing tips

 premium service crypto teaser premium service SP-500

Related posts:

  1. 15 Cryptocurrency Forecasts For 2025
Tags: Bitcoin
Taki T.

Taki T.

Taki is a chart analyst who is passionate about unlocking unique insights out the chart. While the vast majority of analysts remain focused on price analysis, Taki starts with timeline analysis and adds price analysis to this. In doing so, he developed a unique methodology to find opportunities in financial markets, across assets and markets.

Connect with InvestingHaven

Receive top notch forecasts for free.

*We hate spam as you do.

Site Navigation

  • RSS Feed
  • About us
  • Advertising
  • Sponsored Content Policy
  • Mission 2026
  • Sitemap
  • Privacy & Disclaimer
  • Terms of Service
  • Contact Us
investing haven logo

Precious metals market analysis including gold and silver price predictions. Crypto market analysis including highly accurate BTC ETH SOL XRP forecasts.

Copyright © 2025 InvestingHaven

Login to your account below

Forgotten Password?

Fill the forms bellow to register

All fields are required. Log In

Retrieve your password

Please enter your username or email address to reset your password.

Log In

Receive our FREE crypto predictions alerts

Download 50 crypto investing tips
No Result
View All Result
  • News
  • 2025 Forecasts
    • 10 market predictions
    • Dow Jones forecast 2025
    • S&P 500 forecast 2025
    • Nasdaq prediction 2025
    • Best crypto to buy now
    • Which crypto will explode
    • Best altcoins to buy
    • 15 crypto forecasts 2025
    • Which precious metal to buy
  • Silver articles
    • Silver prediction 2025 – 2030
    • Will silver exceed $30?
    • When will silver hit $50?
    • Can silver hit $100?
    • Silver shortage
    • 50-year silver chart
    • Silver bullish reversal
    • Silver seasonality charts
    • How to invest in silver
  • Gold
    • Gold prediction 2025 – 2030
    • Will gold set new ATH?
    • Will gold hit $3,000?
    • Can gold hit $10,000?
    • Gold chart 10 years
    • Gold chart 50 years
    • Gold chart 100 years
    • Gold silver ratio
    • Gold seasonality charts
  • Commodities
    • Sugar forecasts
    • Coffee forecasts
    • Nickel forecasts
    • Lithium investing
  • Crypto news
  • Crypto forecasts
    • BTC prediction 2025 – 2030
    • ETH prediction 2025 – 2030
    • SOL prediction 2025 – 2030
    • XRP prediction 2025 – 2030
    • XLM prediction 2025 – 2030
    • BNB prediction 2025 – 2030
    • ADA prediction 2025 – 2030
    • AVAX prediction 2025 – 2030
    • KAS prediction 2025 – 2030
    • NEAR prediction 2025 – 2030
    • BCH prediction 2025 – 2030
    • LINK prediction 2025 – 2030
    • DOT prediction 2025 – 2030
    • SUI prediction 2025 – 2030
    • ICP prediction 2025 – 2030
    • LTC prediction 2025 – 2026
    • STX prediction 2025 – 2030
    • DOGE prediction 2025 – 2030
    • SHIB prediction 2025 – 2030
    • PEPE prediction 2025 – 2030
    • FLOKI prediction 2025 – 2030
    • WIF prediction 2025 – 2030
    • ONDO prediction 2025 – 2030
  • Premium Crypto Alerts
  • Premium services

Copyright © 2025 InvestingHaven

×