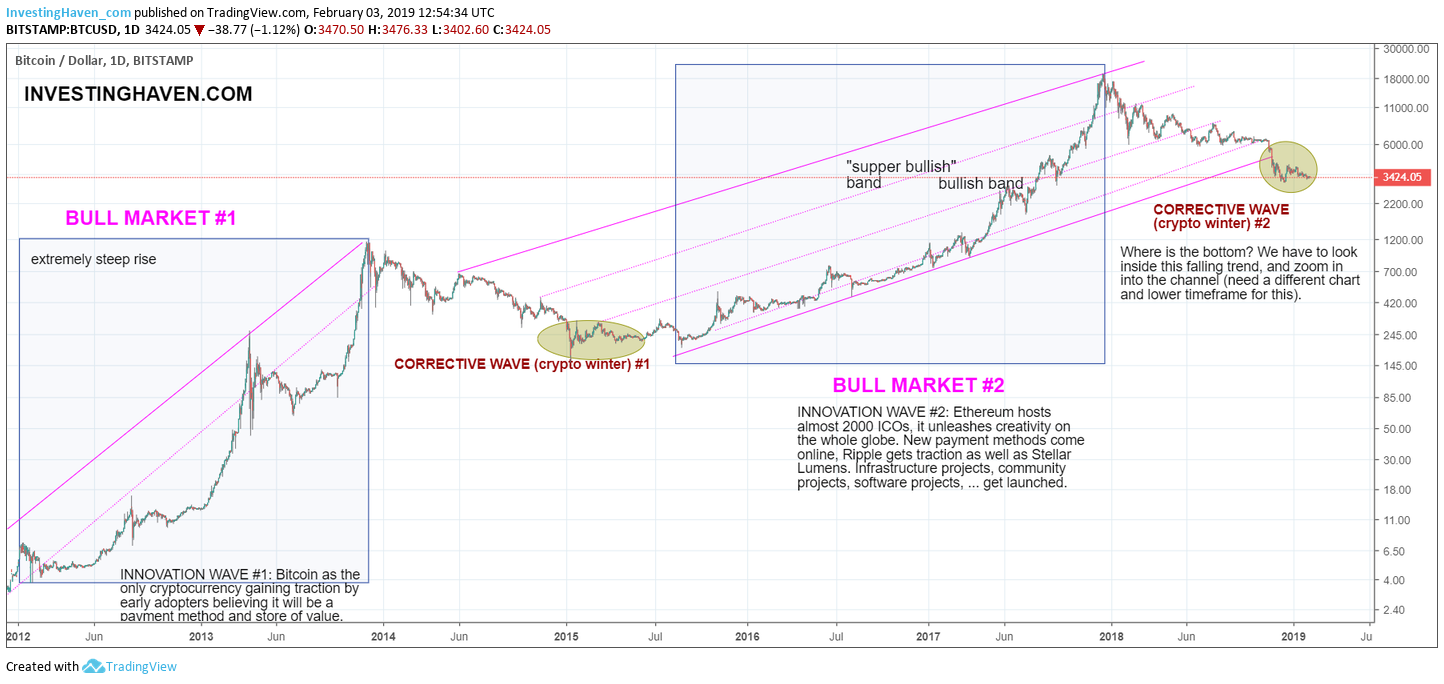
Is our Bitcoin forecast for 2019 underway? Most likely yes, even if the timeline is delayed. This Bitcoin historical price chart make the point that a giant consolidation may have started. It primarily is morphing into a pattern that is similar to 2015, which, as we all know, was the basis for a great rally in subsequent years.
As per our Bitcoin (BTC) forecast we said “it is “realistic to expect a $25,000 #Bitcoin price forecast for 2019/2020. Previous all-time highs will be taken out, but Bitcoin’s rise will not be as steep as the previous bull markets because of Bitcoin futures.” This finding is also consistent with our 5 Must-Read Cryptocurrency Predictions for 2019.
Horrible Sentiment Seen On Bitcoin’s Historical Price Chart
The general sentiment about crypto is really horribly bad.
A horrible sentiment is what happens when we see news items like “the longest bear market ever” as published by Coindesk.
And that’s a great thing, because bear markets beget bull markets, as per our 100 investing tips!
Bear markets beget bull markets. It is at the depth of a bear market that all sellers leave, which makes place for a market to consolidate and set the basis to turn into a future bull market.
People are doubting whether the crypto bull market will ever resume. We make the point that the next crypto bull market will be there the latest by 2020. The answer to this question is easily derived from below chart which maps fundamental analysis with chart analysis as per our proprietary method of our blockchain investing research service.
It is the same Bitcoin historical price chart which may be seen as very bearish, nicely fitting into the bearish sentiment, that also has a totally different take-away. Continue reading to see what we mean.
Similar Bearish Sentiment At The Depth Of Bitcoin’s Historical Price Chart
InvestingHaven’s research team applies one important principle: ‘start with the chart’. And creating awesome charts which set the stage for great insights is our primary drive.
If we check Bitcoin’s historical price chart it becomes clear that Bitcoin broken the rising trend that started in 2015. This rising trend moved in a ‘pixel perfect’ rising channel. It ultimately led Bitcoin to this magic top of $20,000 some 13 months ago.
Now here it becomes is interesting, because we just said that 2015 was the start of a new bull market. But 2015 was still a bear market, one that most thought would mark the end of Bitcoin and cryptocurrencies?
Not convinced, this just a subset of news that was published back then:
- “Will Bitcoin ever rebound”, published by CNN early 2015. This is a great quote from that article: “Bitcoin was a bubble that has burst. Jeffrey Gundlach, head of influential investment firm DoubleLine, is firmly in the Bitcoin bear camp. In a webcast on Tuesday, Gundlach declared that Bitcoin is “on its way to being relegated to the ash heap of digital currencies.”
- “Is Bitcoin headed to fresh new lows” published in March 2015. This article came out AFTER the low of January, after which Bitcoin never came back to that point.
Indeed, we start seeing that what is happening now is the opposite of ‘how it feels’. It may feel bad, but that’s a reason to think of buying.
It’s the opposite of what the herd has been doing. Remember Dec 2017, when the whole world was going wild with crypto? ‘Buy Bitcoin‘ were the only 2 words that people wanted to hear! That’s when this sell alert was published on CNBC. People ignored this, but it was a heroic call. And the majority of people said 12 months “I wish I had listened.”
Bitcoin Historical Price Chart As The ONLY Source Of Information
Bitcoin’s historical price chart shows that Bitcoin fell through its rising channel a couple of months ago. This is not the most bullish development, admittedly. But the whole point is that this is part of the corrective cycle in the context of the 2nd bull market with subsequent bear market.
What we believe is that institutional money is waiting to enter the crypto space. The new crypto bull market will be driven by institutional money in combination with the new wave of innovation and adoption which will come from security tokens combined with stablecoins.
One thing is clear: Crypto is NOT dead, crypto is alive and kicking. That’s what Bitcoin’s historical price chart says to us, and it keeps on improving with each passing day that Bitcoin remains stable around current price levels (while sentiment becomes worse). We like this, a lot even!
We give a lot of illustrations of this in our blockchain and crypto investing research service, as well as actionable tips. You too can become a premium member.


