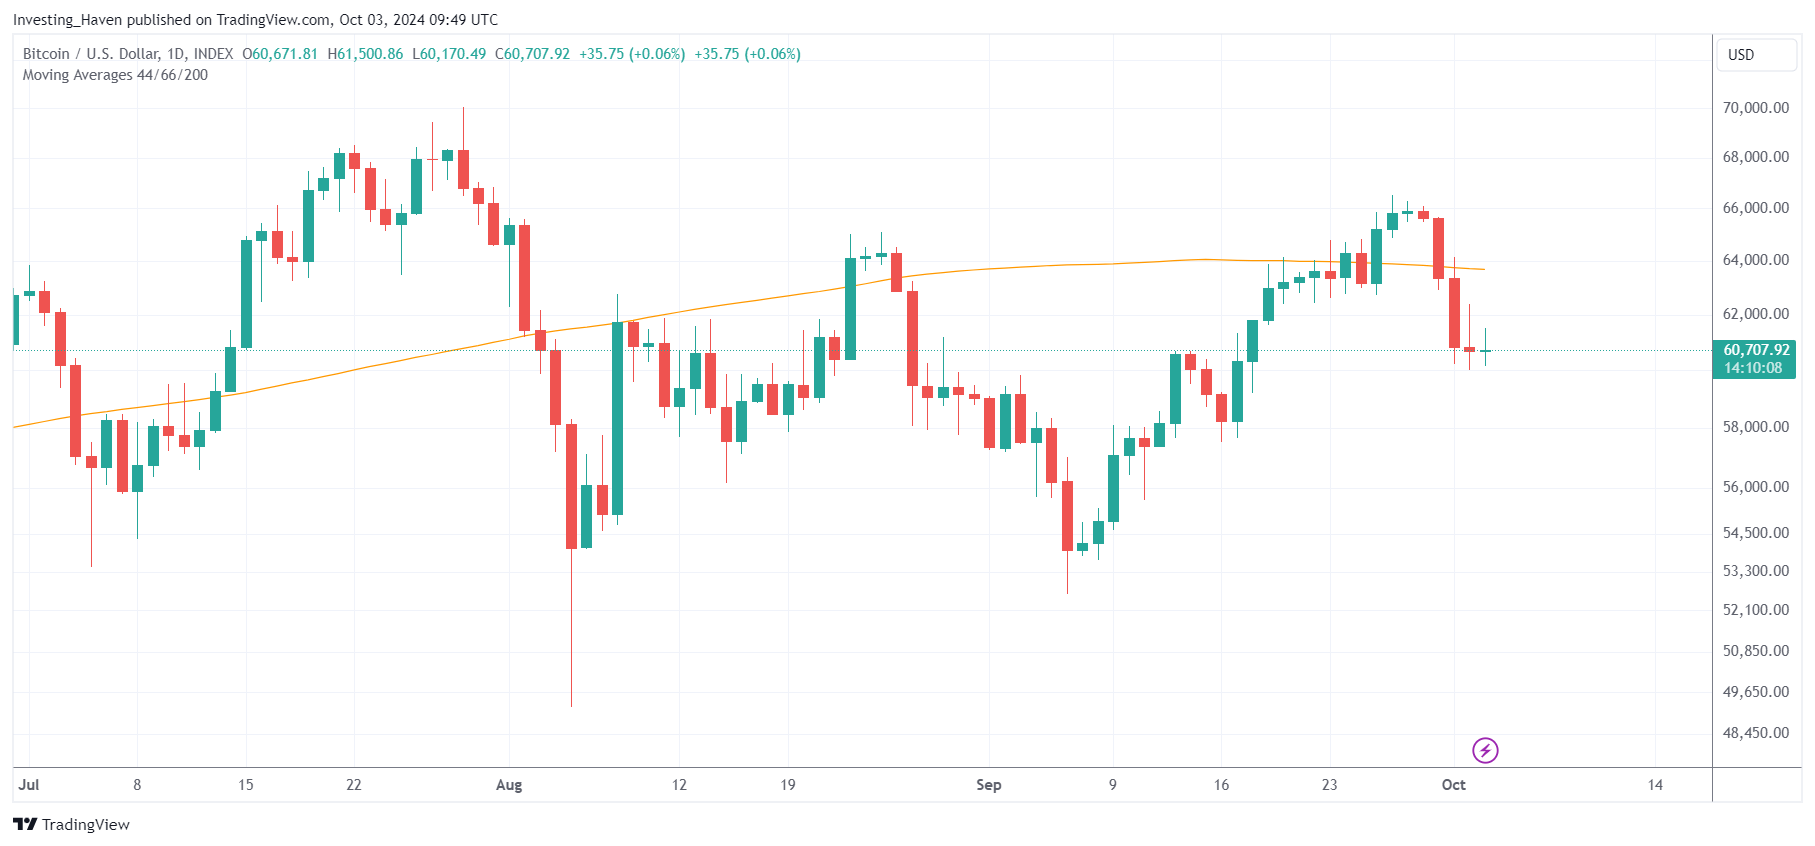
In sum, the Bitcoin (BTC) price drop was to be expected for several reasons: no bullish momentum in markets, war looming, Bitcoin’s 200-day MA falling for the first time in 640 days.
READ – Bitcoins 200-Day Moving Average Drops for the First Time in 640 Days. Should Investors Worry?
The price of Bitcoin in the last 6 days:
- On Sept 27th – peak price of $66.3k.
- Today – BTC dropped to $60.3k.
Why is the price of BTC dropping? Is this the start of a deeper pullback or a ‘buy the dip’ opportunity?
Note – According to our latest crypto forecast for 2025, the latest BTC prediction 2025 is a bullish resolution. The only unknown is from which support level exactly in 2024? In other words, how much can BTC drop from here, is the one and only thing that truly matters!
Bitcoin’s 200-day moving average now falling
The problem with Bitcoin, currently, is that it’s 200 day-moving average is falling since October 1st, 2024.
It’s the first time since Jan 1st, 2023, which is 640 days ago, that Bitcoin’s 200 dma is falling.
On the one hand, this 200 dma is a lagging indicator. We don’t read much into this trend change, simply because of it tremendous lag.
On the other hand, the 200 dma is an indicator that is too obvious. The market is never obvious.
Still, it’s a trend indicator, one that has some sort of meaning. Clearly, once it turned down, on Oct. 1st, algos and bots took this is a sell signal.
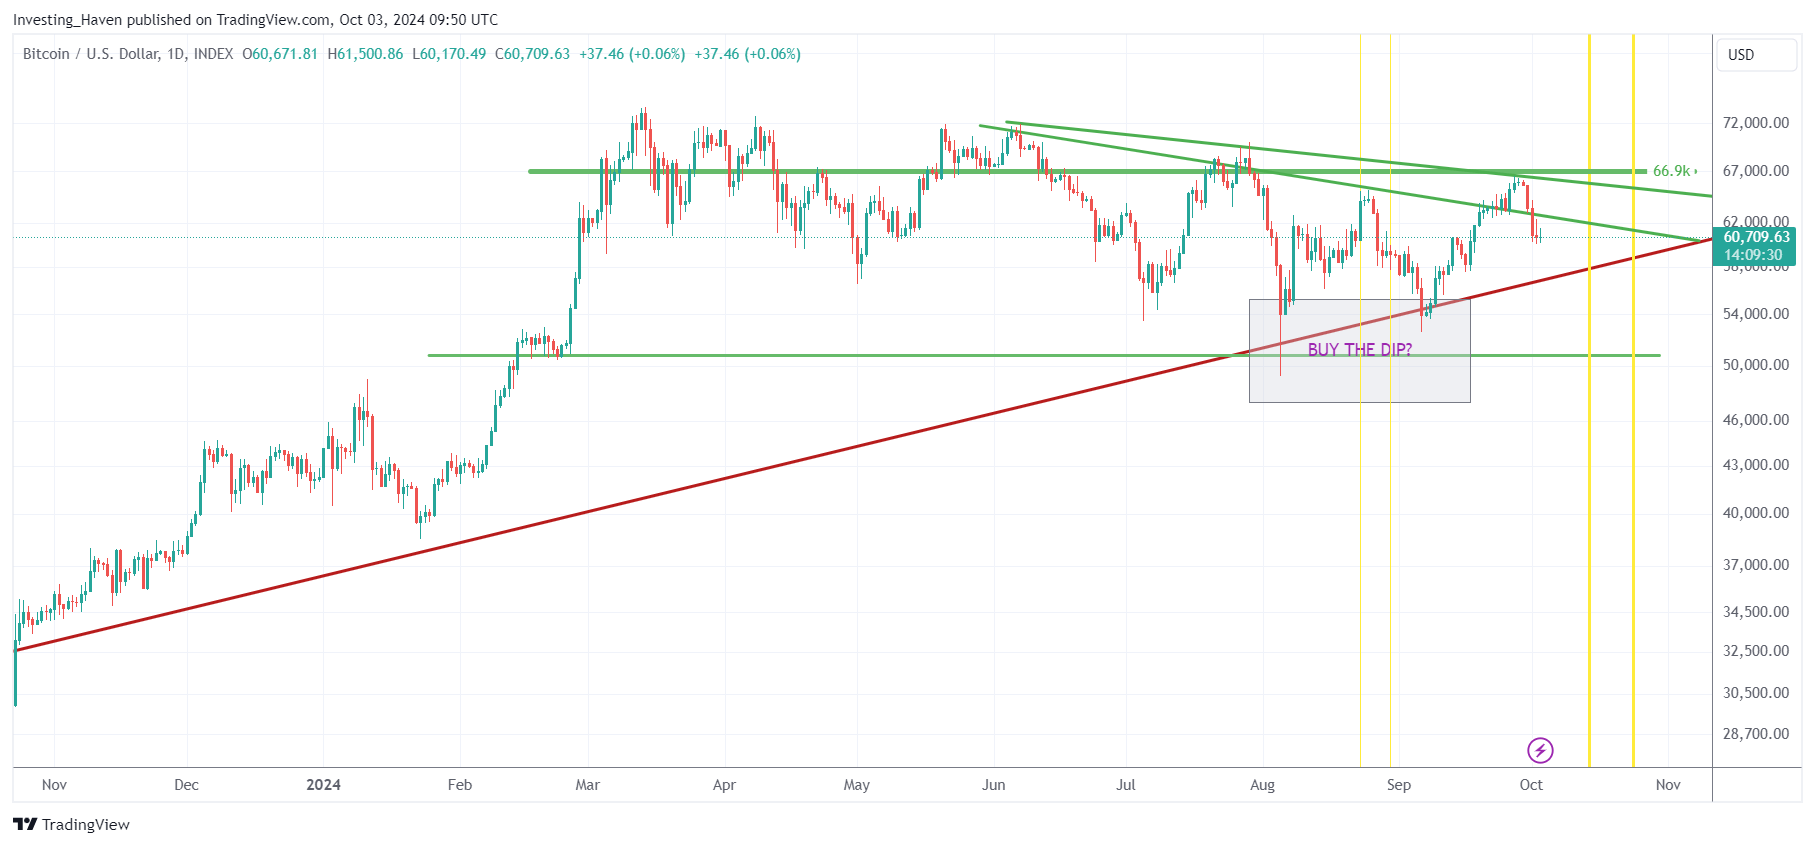
On the flipside, as long as the summer lows are respected, there is a series of higher lows on the Bitcoin chart, which is the most encouraging long term observation of this chart.

BTC suffering of lack of momentum
Bitcoin is the ultimate momentum asset. The more momentum in markets (very often driven by liquidity), the stronger momentum in Bitcoin and crypto.
Consider this:
- Stock indexes are unable to make new all-time highs, they found resistance at their ATH.
- Gold is rising presumably because of rising fear.
- The U.S. Dollar is bouncing from its 100-point level – not great.
Bitcoin is unable to make new highs in this environment. This makes sense.
More time is needed – nothing wrong with that.
BTC vulnerable to volatility windows
The last months of 2024, particularly since August 2nd, are characterized by multiple volatility windows.
Timeline analysis suggests resistance in the third and fourth quarter. So far, this prediction has proven accurate. This implies that the ongoing consolidation is set to continue, presumably until January, after which momentum trends can develop again to crush ATH.
Volatility windows are here to stay for a few more months.
The only thing that matters for BTC is ensuring solid support is created.
BTC vulnerable to looming escalation of war
Tensions in the Middle East are about to explode.
Iran braces for Israeli strikes as supreme leader calls for west to leave Middle East
Iran is bracing itself for likely Israeli attacks on its nuclear sites as the supreme leader, Ayatollah Ali Khamenei, urged the west to leave the Middle East.
With an escalation brewing, there is no way momentum can develop.
It’s impossible.
More time is needed so things calm down again, and markets can relax with new ATH in BTC.
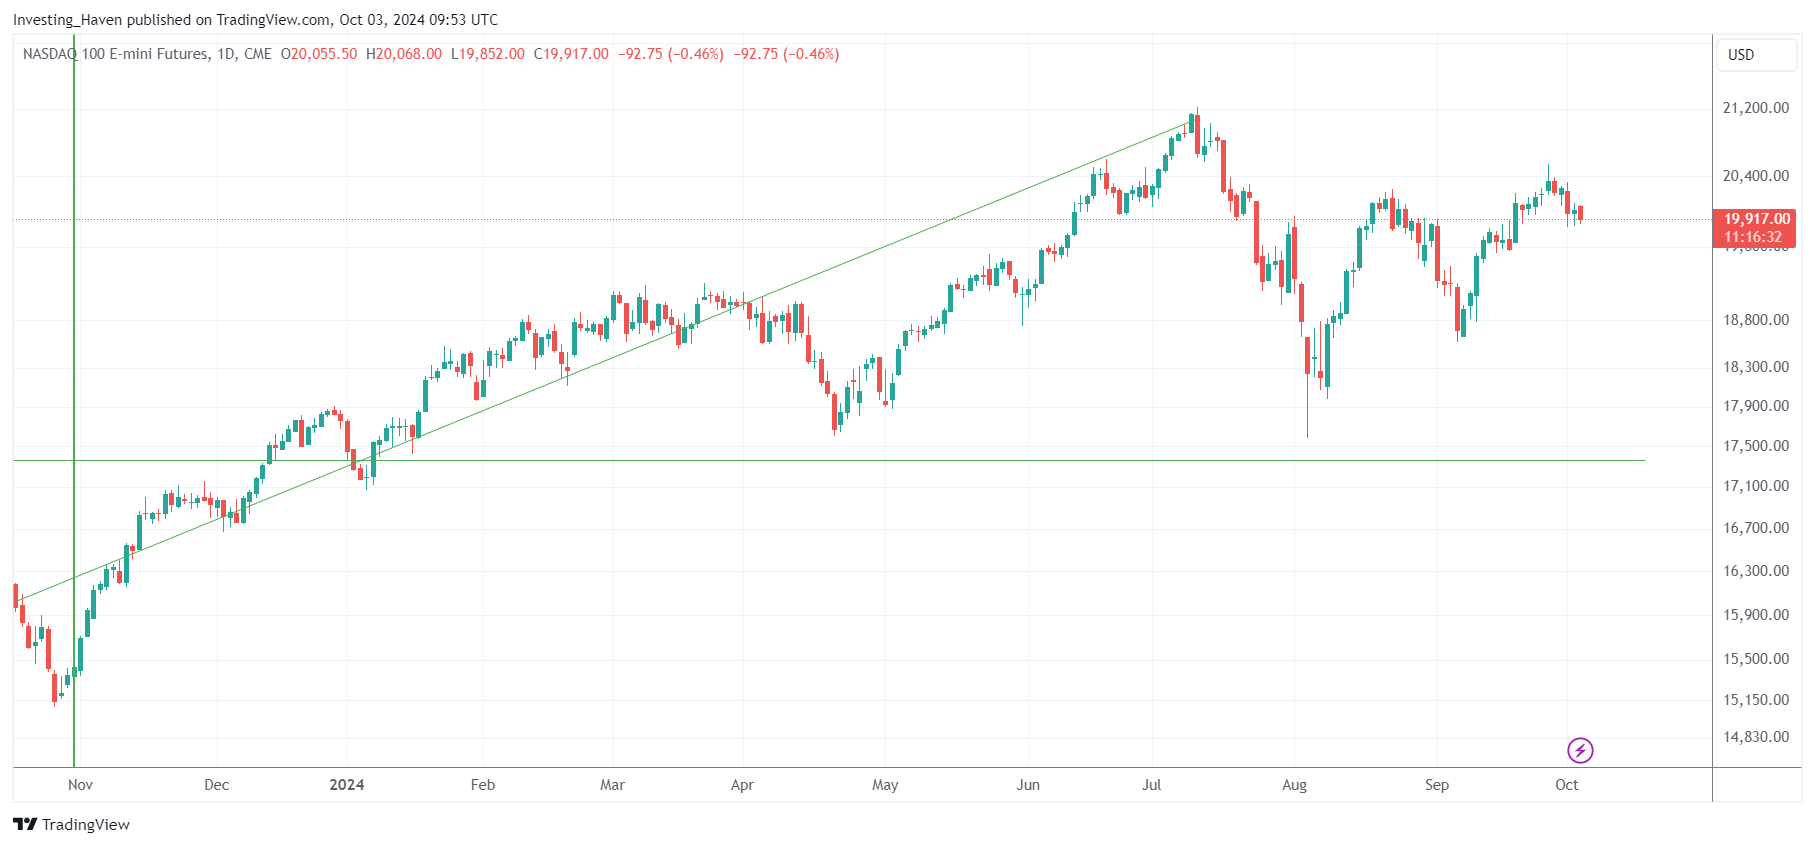
BTC correlated with the Nasdaq failing to clear ATH
The Nasdaq and BTC are strongly correlated, directionally.
As seen on the Nasdaq chart, a local top is being printed currently.
This implies a drop is likely, in the coming 4 to 8 weeks, which also implies that BTC cannot move to set new ATH in the short term.
The good news – BTC tends to front run markets and the Nasdaq. Remember, back in Oct. 2020, Sept. 2021, Oct. 2023, BTC was the first to react higher after which broad markets followed suit. So, in a way, the Nasdaq is lagging Bitcoin. We want to see higher lows in BTC in Oct and Nov.

Bitcoin price dropping – how much more downside?
Overall, with all points outlined above, we seriously doubt whether BTC will be able to clear $66k sustainable (for more than 8 to 13 consecutive days) in Oct or Nov.
On the flipside, there is a very strong support structure on the BTC chart.
The odds favor a slow consolidation in Oct.
A move below the rising trendline would be concerning, truth to be told even if it’s a low probability outcome!

The BTC chart clearly established a decision area in the first week of November. Probably, the date to watch is November 10th +/-3 days. Receive our premium alerts for more timely crypto alerts >>


