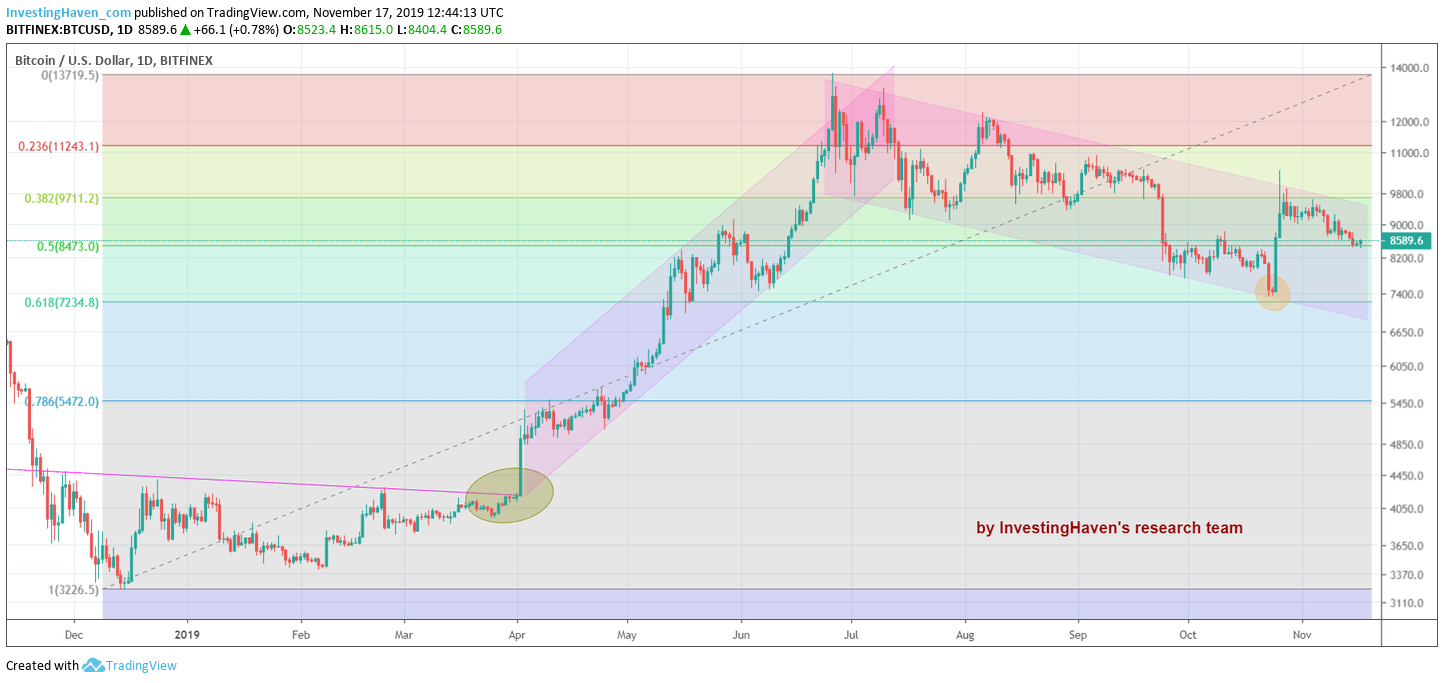
Bitcoin is usually extremely volatile. In the last 3 months though it is behaving in a very unusual way. There is mostly a neutral price action (very low daily changes) combined with 2 major price changes. The first one was a strong correction mid-September, the second one was a giant rally towards the end of October. What’s most interesting is that both major price changes took place at 2 of the most important Fibonacci levels. Guess what. Right now, BTC is trading right at the 50% Fibonacci retracement level, another critical price point. The good news for the crypto bulls is that it looks to bounce from current levels, and that even with additional downside the long term uptrend is still intact. At InvestingHaven we have a bullish 2020 forecast, and we are in the process of adding a Bitcoin forecast to our series of annual market forecasts.
Before looking at the chart which reveals the point we are making in this article we want readers to spend a few minutes on previous articles.
That’s because it is so easy to get caught up on all those news items out there, and forget about the big picture. With social media and social investing people tend to focus too much on the very short term. However, for investors the big picture is crucial.
We urge readers to check our recent articles, published in the last 10 weeks, and verify the ideas and observations shared in there. All important insights, and they should be the basis for looking at and thinking of Bitcoin as the leader of the crypto market.
5 Reasons Why Bitcoin Is (Super) Bullish Going Into 2020
Is Bitcoin Really In A Bear Market? Not According To Its Chart!
Is Bitcoin’s Powerful Uptrend Intact Going Into 2020? Yes, It Is!
Bitcoin Is Obviously Doing What Is Least Obvious
Bitcoin’s Long Term Chart Strongly Bullish Going Into 2020
As for BTC at the time of writing we thought it was helpful to look at the Fibonacci levels. Those are the retracement levels of the big surge that started early this year.
As seen on below chart the .382 and .618 retracement levels have been proven to be instrumental. The .382 level marked the start of this major breakdown in September. Most people were scared a lot, but in the end what really mattered is how far the retracement went. Good news for the bulls: the retracement ended right at the .618 level where a giant rally started.
Today, we see BTC trading *exactly* in between both levels. It trades right at the 0.50 retracement level.
We believe this may be the end of the ongoing retracement. Why? Because Fibonacci works well when combined with classic chart analysis. And in doing so we see that the current price is former (in October) resistance. If former resistance is becoming support, which is likely because of the importance of the 0.50 retracement level we might be looking at the preparation of a major breakout.
The odds favor BTC moving higher to the top of this 5 month falling channel. And as the 0.382 level now moved above the channel we believe there is a fair chance that it will result in a break out of the currently falling channel.
Ed. note: The members of the cryptocurrency investing service not only receive this type of chart but also many other crypto charts. We share on a weekly basis deep insights, and actionable tips. For instance we flashed in the first week of October a buy alert on a cryptocurrency that is trading 50% higher in the meantime. It is #2 in our top crypto list. Moreover, one of the very small cryptos (top 120) got a buy alert, and it is trading 3x higher in the meantime. It is #5 in our top crypto list, and rising strongly. Discover instantly our top crypto #2 and #5 by signing up here >>


