After a 10% pullback, Bitcoin may retest $108,000 if support breaks. Watch ETF flows, exchange inflows, and leverage.
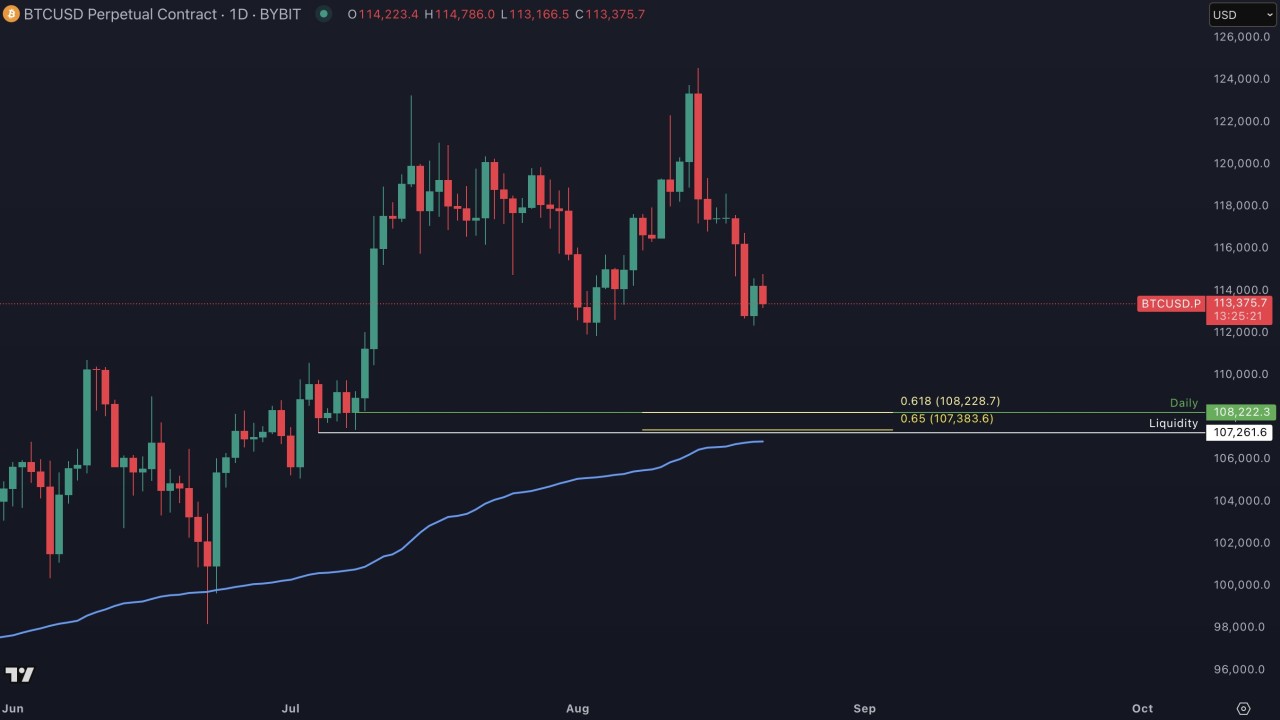
Bitcoin fell over 10% from recent highs and now trades around $110,000, making a short term retest of $108,000 plausible if immediate support fails.
We could see a correction to $108,000 after the pullback, citing broken weekly support and fragile intraday ranges.
Traders expect higher volatility as they monitor Fed cues and ETF flows.
RELATED: Week Ahead: Can Bitcoin Sustain This All-Time High Momentum?
Bitcoin Price Action And Technical Triggers
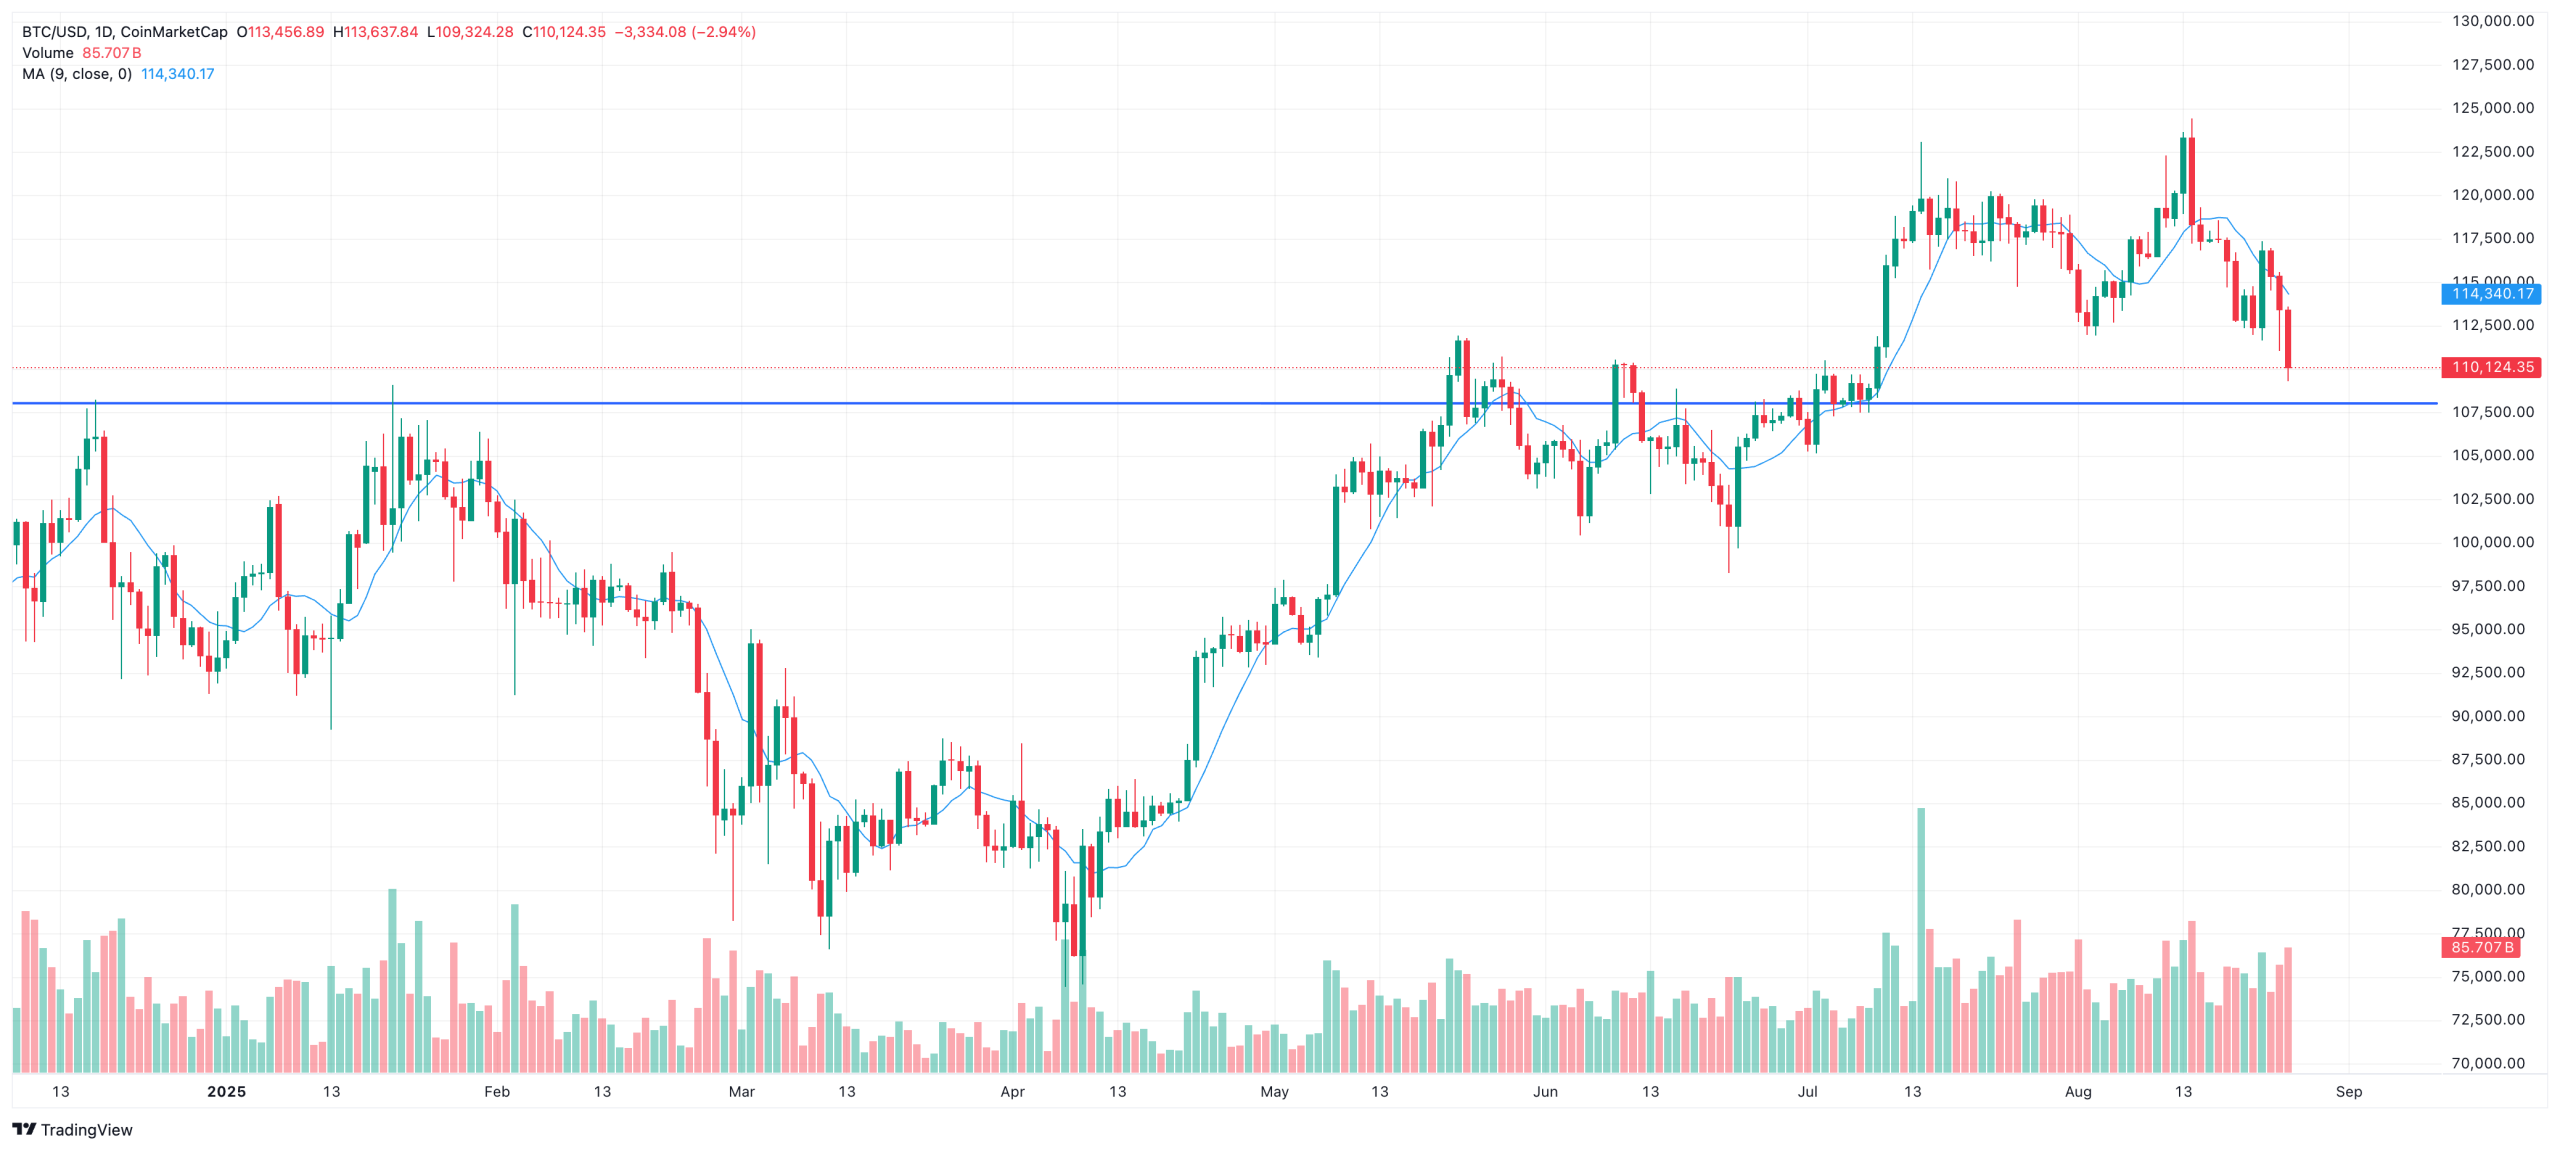
Price action has turned cautious after a sharp retracement from Bitcoins recent peak around $124,500. Last week BTC bounced around intraday support close to $112,700 while resistance formed around $114,800.
A clear break below that opened a path to $110,000 which may continue to break lower. Weekly and horizontal support failed across 1 hour, 2 hour and 4 hour charts, and a head and shoulders pattern with a neckline near $112,000 was broken.
Short term momentum reads bearish, yet oversold daily RSI and Stochastic suggest a temporary bounce to about $119,000 as short positions cover. Traders watching the neckline treat a close below $112,000 as confirmation to reduce exposure and tighten stops.
RECOMMENDED: Want to Make $1M with Bitcoin? Here’s How in 10 Years
On chain Flows and Liquidity
On chain flows and market liquidity sharpen the risk profile. CryptoQuant and Glassnode show more than 20,000 BTC moved to exchanges at a loss by short term holders over recent days, signaling realized losses that can pressure prices if buyers fail to absorb sales.
Spot volume spiked and liquidations reached about $300 million during the pullback, magnifying volatility and increasing the odds of stop hunts.
If ETF net flows slow or reverse and futures leverage stays high, the liquidity gap between $112,000 and $108,000 could attract rebalancing sales.
Traders should track exchange inflows, STH SOPR and ETF daily flows closely.
RECOMMENDED: Do Not Invest in Bitcoin or XRP Before You Know This
Scenarios And Tactical Checklist
Two clear scenarios unfold. Break and hold below $112,700 targets $108,000, so place stops above local resistance and monitor exchange inflows.
If Bitcoin reclaims $115,000 to $118,000 with steady ETF inflows, the market can resume an uptrend toward $119,000 to $124,000.
Watch futures open interest and funding rates for clues.
READ ALSO: Can You Create Wealth From Bitcoin?
Conclusion
A move to $108,000 now looks plausible but not inevitable. Watch $110,000 to $115,000, ETF flows, exchange inflows, and futures leverage to decide whether to buy dips or preserve capital.
Buy Bitcoin With The Best Crypto Exchange for Intermediate Traders and Investors

Invest in cryptocurrencies and 3,000+ other assets including stocks and precious metals.
0% commission on stocks - buy in bulk or just a fraction from as little as $10. Other fees apply. For more information, visit etoro.com/trading/fees.
Copy top-performing traders in real time, automatically.
eToro USA is registered with FINRA for securities trading.
30+ million
Users worldwide
Don’t Miss the Next Big Move – Access Alerts Instantly
Join the original blockchain-investing research service, live since 2017. Our alerts come from a proprietary 15‑indicator methodology built over 15+ years of market experience. You’re following the service that identified major turning points through crypto winters and bull runs alike
Act now and see why thousands trust us to deliver signals before markets move.
This is how we are guiding our premium members (log in required):
- Crypto Shows More Resilience Than Expected. A Bullish Impulse May Be Underway. (Aug 9th)
- Prepare To Buy The Dip In Crypto (Aug 2nd)
- Alt Season 2025 – Progress Update (July 26th)
- This Is What Bullish Basing Patterns Look Like (Hint: Alt Season Starting) (July 20th)
- Is Alt Season 2025 Here? (July 15th)
- Alts Breakout Happening Now. These Are Price Time Combinations To Watch. (July 11th)


