
KEY TAKEAWAYS
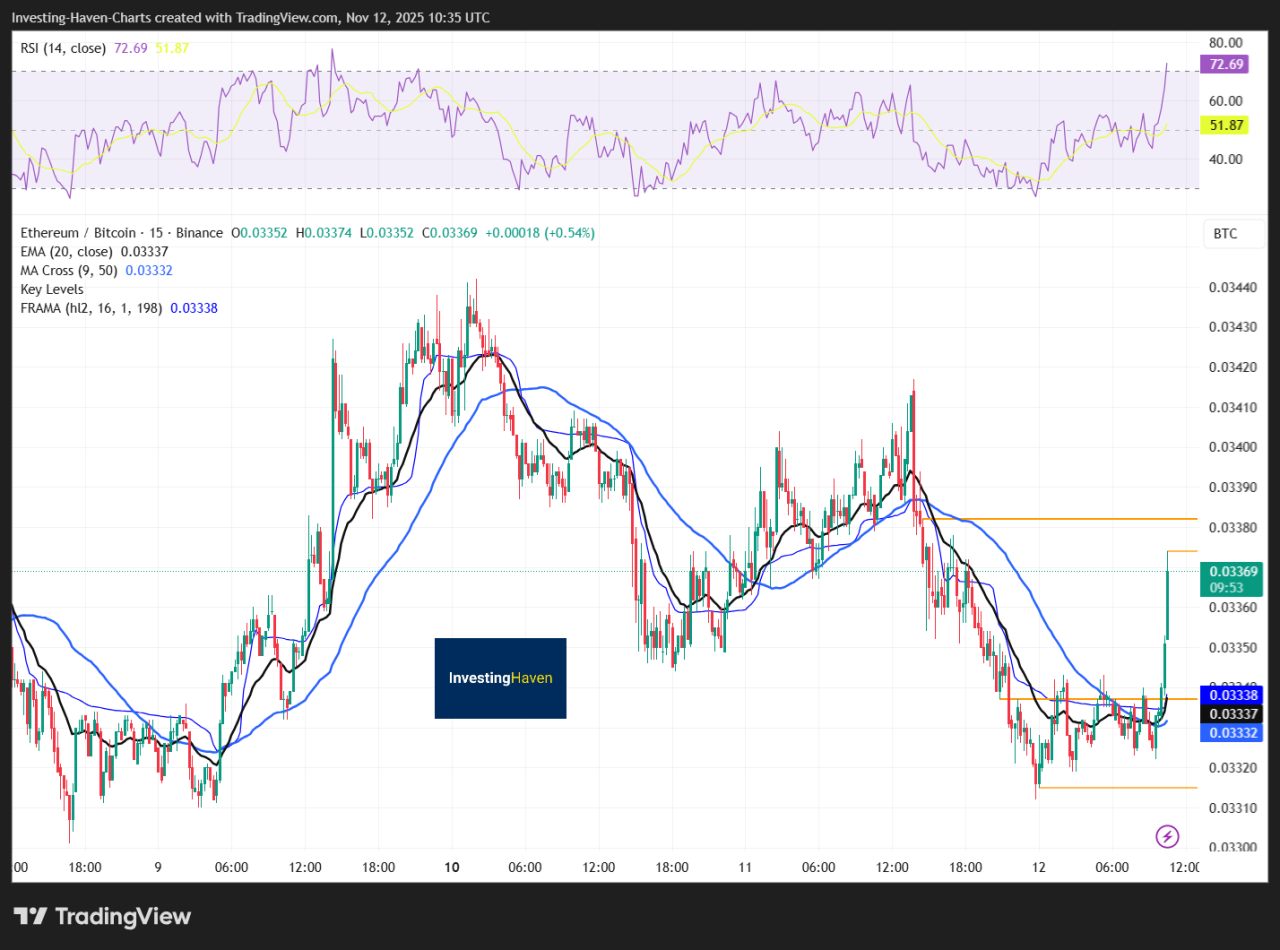
- The ETH/BTC ratio sits around 0.0333, showing BTC still holds a slight performance edge.
- ETH needs a weekly close above 0.037 and its 50-week EMA to confirm real strength.
- A weekly RSI move above 50 and a rising MACD would signal renewed ETH momentum and a possible trend reversal.
ETH still lags behind BTC with the ratio around 0.0333. ETH needs a clear breakout above 0.037, plus improving momentum, to confirm real strength.
I have been seeing analyses to the effect that ETH is outperforming BTC. There have been times ETH was rallying more aggressively but look at the ration, this might no longer be the case. Right now, the ETH/BTC ratio sits around 0.0333, down from its 0.037 high earlier this year.
BTC look to be more in control. Still, to go beyond the number and look at momentum – especially the RSI and MACD – because they show what traders are really doing behind the scenes. So, let’s look at a BTC vs ETH comparison to see which is stronger.
BTC vs ETH: ETH/BTC Ratio And Key Levels
ETH has been sliding since midyear, holding below both the 50-week and 200-week EMAs. That setup usually means BTC is outperforming.
Now, when you see this pattern, don’t panic or jump to conclusions. Instead, treat it as a watch zone. If ETH manages to reclaim 0.037 and close above its 50-week EMA, that could be a first sign of a true shift toward ETH strength.
ETF inflows have helped ETH in the past, but price action always matters more. Right now, we see steady but not explosive trading volume, which suggests the market is waiting for a clear catalyst.
We may not see that happen unless Bitcoin cools off or ETH starts attracting new liquidity from staking demand or layer-2 adoption.
RECOMMENDED: Is Ethereum (ETH) A Good Investment? 7 Factors You Should Know
Momentum Check: Weekly RSI And MACD
Momentum confirms what the ratio shows. Weekly RSI sits around 44, below the 50 mark that separates strength from weakness. MACD bars are small and flat, which tells us ETH rallies keep losing steam.
From experience, the best time to add exposure could be when RSI crosses 50 while MACD flips upward together. That’s the combo we are watching closely.
RECOMMENDED: Will Bitcoin Break Out in November? What ETF Flows and CPI Trends Reveal
Conclusion
Right now, ETH isn’t showing enough relative strength to challenge BTC’s lead. The ratio near 0.0333 and soft momentum confirm it. A clean RSI move above 50 and a rising MACD could turn ETH bullish.
If that setup appears, ETH could retest 0.037 and begin a stronger phase. Until then, BTC remains the steadier anchor for most portfolios.
Join eToro today and receive $10 in free crypto on your first deposit. Trade crypto, stocks, and ETFs with powerful tools and social investing features like CopyTrader™
Crypto investments are risky and may not suit retail investors; you could lose your entire investment. Understand the risks here
Don’t Miss the Next Big Move – Access Alerts Instantly
Join the original blockchain-investing research service — live since 2017. Our alerts come from a proprietary 15‑indicator methodology built over 15+ years of market experience. You’re following the service that identified major turning points through crypto winters and bull runs alike
Act now and see why thousands trust us to deliver signals before markets move.


