Large ETF inflows tightened supply and lifted Bitcoin through major resistance. Support at $116k and derivatives positioning now guide the outlook.
Bitcoin ETFs absorbed roughly $3.2–3.3B in net inflows last week, marking one of their largest weekly totals. This surge reduced available supply and helped price climb above key resistance levels.
The week ahead will depend on whether inflows continue at this pace and if charts confirm the breakout.
RECOMMENDED: Is It Too Late To Buy Bitcoin In 2025?
ETF Flows: Pace, Concentration, And Impact
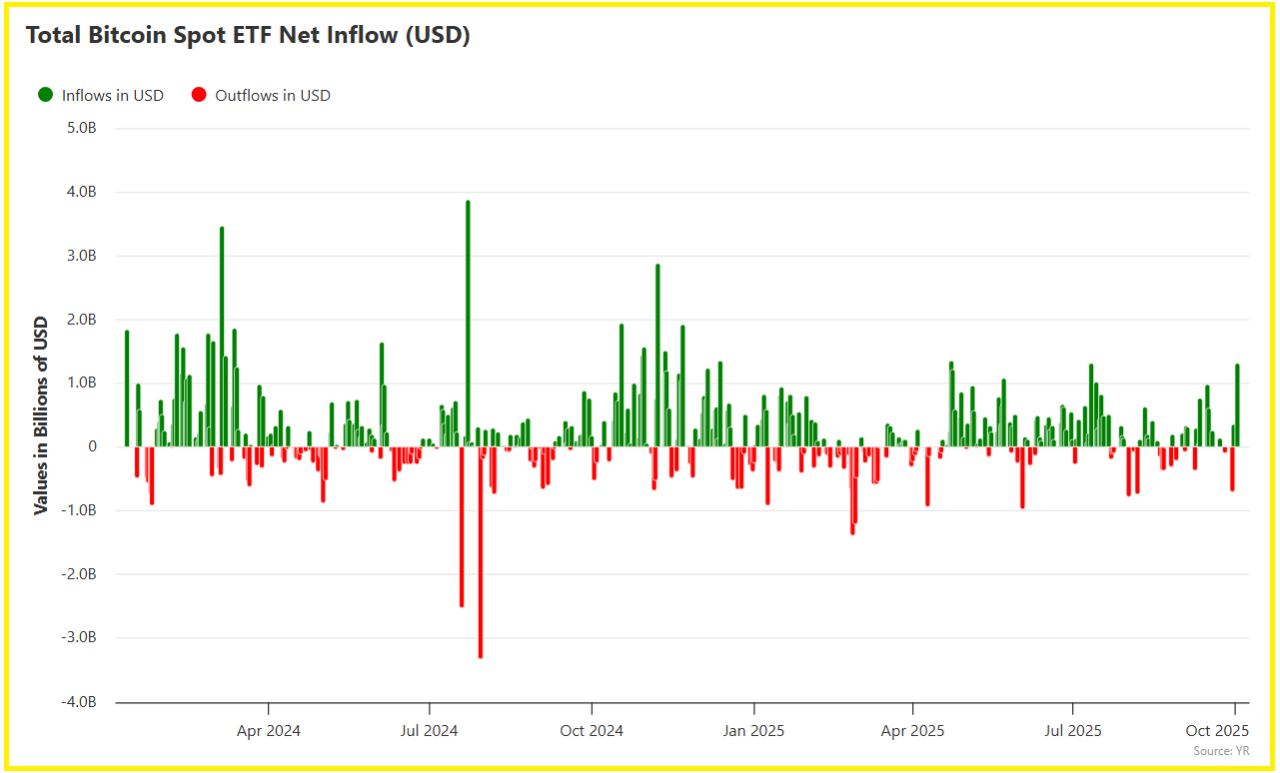
Last week’s net inflows reached about $3.2–3.3B, one of the strongest weekly totals since spot ETFs launched.
Most of this demand came from a few large issuers, which highlights how concentrated institutional buying has become. Charting cumulative flows across providers helps track whether this concentration continues or starts to broaden.
As long as inflows remain steady, buying pressure tends to support price strength. If flows slow for two consecutive weeks, the risk of a sharper pullback rises quickly.
RECOMMENDED: Bitcoin $200K in 2025? Scaramucci Reaffirms Bold Bitcoin Price Forecast
Price Structure: Key Levels And Liquidity Zones
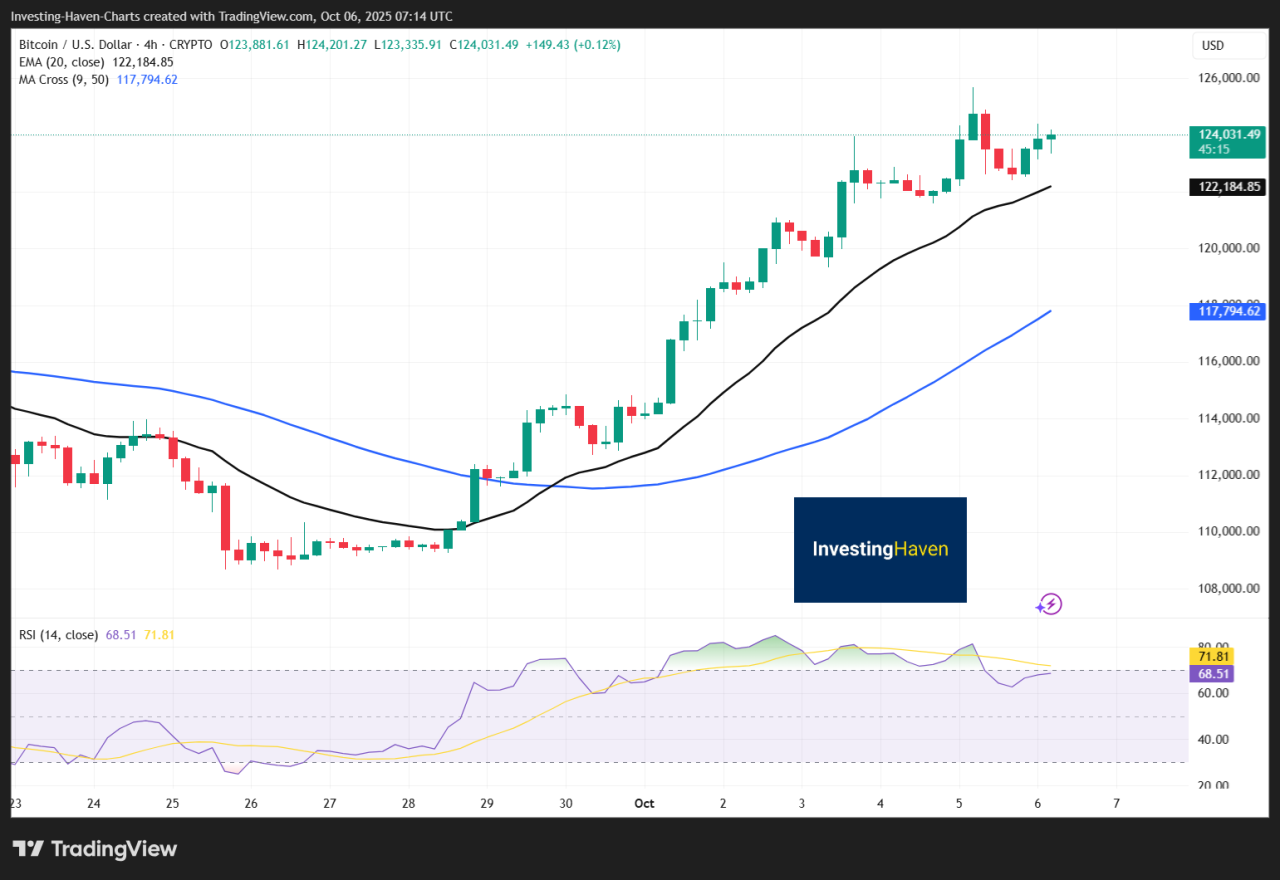
Bitcoin recently surged through the $120k–$125k zone, turning it into a key reference for both support and resistance. Traders are now watching whether price can hold above $116k, which would confirm the breakout.
Using volume profiles and moving averages such as the 21-week and 50-week EMAs highlights where liquidity clusters are forming. A sustained close below $116k would weaken the current structure and increase the chance of a retracement into the $100k–$111k range.
ALSO READ: What Will $1,000 in Bitcoin Be Worth in Five Years?
Exchange Flows And Derivatives Positioning
Exchange balances show if ETF demand is being met by money leaving exchanges or by fresh supply entering the market. A steady decline in exchange balances, combined with positive ETF inflows, usually reduces immediate selling pressure and supports price stability.
Derivatives data adds another layer of insight. Rising funding rates and high open interest often signal that long positions are getting crowded, which can leave the market vulnerable to sharp liquidations.
Options markets also help measure sentiment. An increase in put demand points to growing hedging activity, which can warn of caution building beneath the surface.
RECOMMENDED:
Conclusion
Bitcoin ETF flows remain the strongest signal for the week ahead. If inflows stay consistent and Bitcoin holds above $116k, the structure favors continued strength toward higher levels.
If inflows ease while leverage builds in futures, the market could unwind quickly and pull back into the $100k–$111k range. Watching ETF flows, key support levels, and derivatives funding rates together gives the clearest guide for direction.
Join eToro today and receive $10 in free crypto on your first deposit. Trade crypto, stocks, and ETFs with powerful tools and social investing features like CopyTrader™
Crypto investments are risky and may not suit retail investors; you could lose your entire investment. Understand the risks here
Wondering which crypto to focus on right now?
Our premium members already know.
Since 2017, InvestingHaven’s blockchain research service has been guiding investors through both bull runs and crypto winters.
What makes it different?
Proprietary 15-indicator methodology developed over 15+ years of market research.
Proven track record of spotting major turning points before markets move.
Focused alerts on only the key crypto assets that matter — no noise, no distractions.
Thousands of readers rely on InvestingHaven to stay ahead of the crowd. Now it’s your turn.
👉 Act today and join the original crypto research service — still live and stronger than ever since 2017.
This is how we are guiding our premium members (log in required):
- ATH in BTC = Alt Season 2025 Catalyst? (Oct 5th)
- Crypto Consolidation: When Will Bullish Momentum Return? (Sept 28)
- Is Meme Season Underway? (Sept 19th)
- Alt Season Is Brewing, In Silence. These 3 Charts Tell The Crypto 2025 Story. (Sept 10th)
- Is A Trendless Crypto Market Good or Bad? The Current and Emerging Winners Look Awesome. (Sept 7th)
- BTC Testing Long Term Trendline. Here Is Short and Long Term Guidance. (Aug 26th)
- Crypto – To Break Out Or Not To Break Out? (Aug 23rd)


