Fed-cut pricing and spot ETF moves will set BTC risk this week. Track CPI, daily ETF flows, and $100,000 support.
Markets now price a Fed rate reduction for September while large spot ETF allocations keep shifting Bitcoin supply. Those two forces will decide whether BTC holds the $100,000 technical floor or tests deeper support.
This week, traders should watch the CPI release, daily ETF net flows, and on-chain illiquid supply to map likely directional paths.
RELATED: Bitcoin Price Prediction: Will BTC Break Above $112K This Week or Slip Back?
Macro Cues: Fed-Cut Odds And The Calendar
Fed-funds futures imply a cut is highly likely for the September meeting after the US added just 22,000 jobs in August, a miss that pushed markets toward easier policy pricing.
Futures traders currently price a very high probability of a 25bp move in September, which would weaken the dollar and lift risk assets if confirmed. The next hard data point is the August CPI on Sep 11, the print that will determine whether traders extend or retract the current positioning.
ALSO READ: Top 3 Cryptos to Buy Now as Fed Uncertainty Looms
Spot-ETF Flows And Supply Dynamics
Institutional ETF flows remain a structural input. CoinShares reports US$2.48bn of inflows last week and US$4.37bn for August, with Ethereum funds outpacing Bitcoin in recent weeks while BTC still drew US$748m.
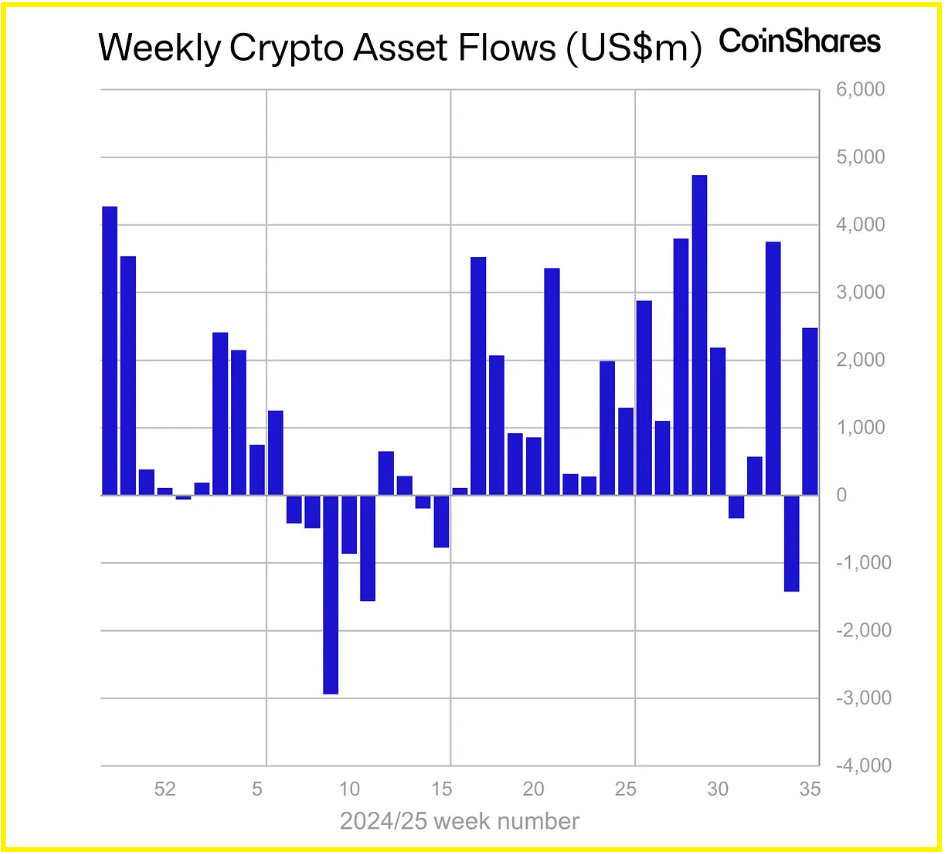
Daily ETF trackers show multi-hundred million dollar inflows and outflows on single days, moves that can compress exchange liquidity and amplify spot swings. Monitor net USD flows into major ETFs and custody concentration for the quickest real-time read on supply pressure.
RECOMMENDED: Crypto Treasuries Boom – Is a Bitcoin Supply Shock Coming?
Charts And Levels To Watch
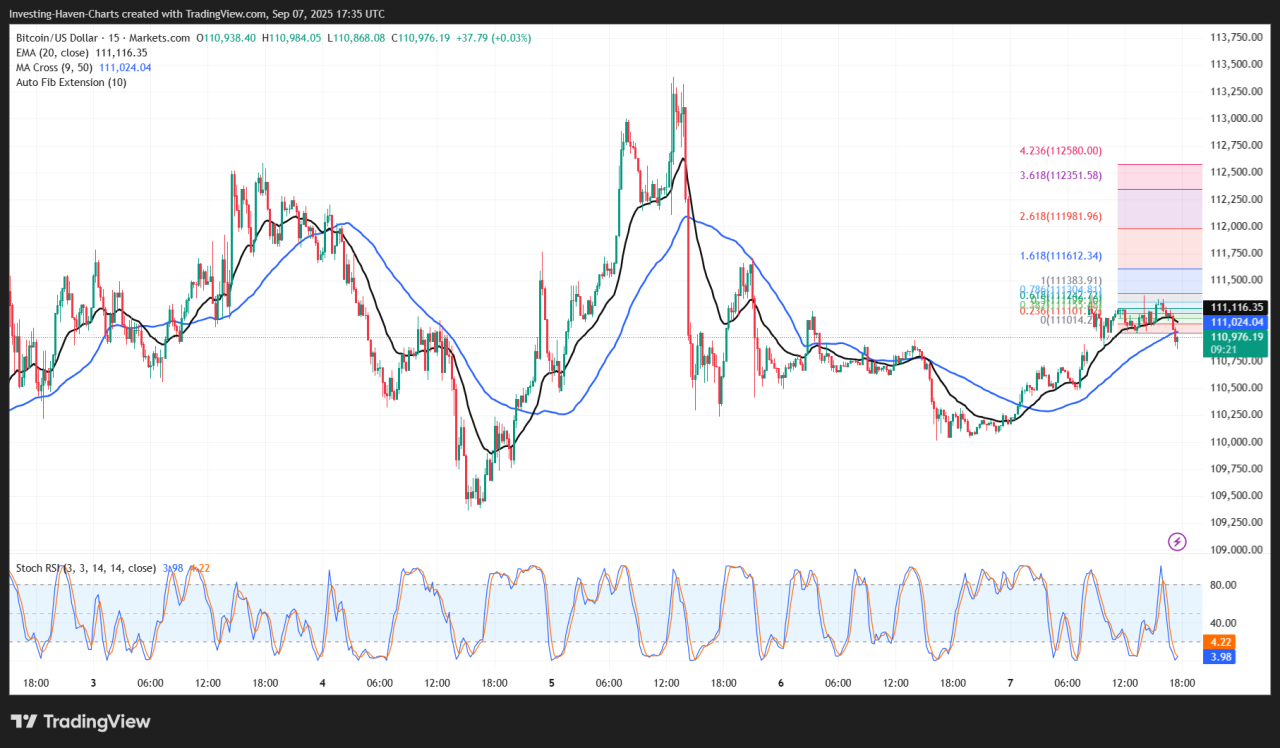
BTC is trading around $111,000 after a pullback from August highs. Key levels to watch this week include $100,000 as the primary decision point, a deeper bearish zone at $93,000, and resistance clustered from $115,000 to $140,000.
Add a daily overlay of net ETF flows, 20/50/200 DMAs and VWAP, and watch on-chain illiquid supply, which rose to a record 14.3M BTC, tightening available float.
RECOMMENDED: Bitcoin $200K in 2025? Scaramucci Reaffirms Bold Price Forecast
Conclusion
Markets fully price a Fed rate cut, with odds above 99% after just 22,000 August jobs added. Meanwhile, large spot ETF flows increasingly reshape Bitcoin supply this week.
This week trade the data: Sep 11 CPI, daily net ETF USD flows, and whether BTC holds $100,000 will decide the directional bias.
Don’t Miss the Next Big Move – Access Alerts Instantly
Join the original blockchain-investing research service — live since 2017. Our alerts come from a proprietary 15‑indicator methodology built over 15+ years of market experience. You’re following the service that identified major turning points through crypto winters and bull runs alike
Act now and see why thousands trust us to deliver signals before markets move.
This is how we are guiding our premium members (log in required):
- BTC Testing Long Term Trendline. Here Is Short and Long Term Guidance. (Aug 26th)
- Crypto – To Break Out Or Not To Break Out? (Aug 23rd)
- What Happened This Week? Leading Indicator Analysis and 7 Token Charts. (Aug 16th)
- Crypto Shows More Resilience Than Expected. A Bullish Impulse May Be Underway. (Aug 9th)
- Prepare To Buy The Dip In Crypto (Aug 2nd)
- Alt Season 2025 – Progress Update (July 26th)


