Dogecoin sits in a tight triangle formation between $0.211 and $0.233, suggesting a possible 40% breakout toward $0.30 if buyers push through with volume.
Dogecoin trades around $0.21 inside a tightening symmetrical triangle on the 12-hour chart. Analysts calculate a 40% breakout could drive DOGE toward $0.30 if it clears resistance near $0.233 with conviction, supported by volume.
That setup places the coin at a turning point where technical resolution may define its short-term trajectory.
RECOMMENDED: Is Dogecoin a Good Buy Now?
Dogecoin Triangle Setup – Key Levels & Technical Indicators
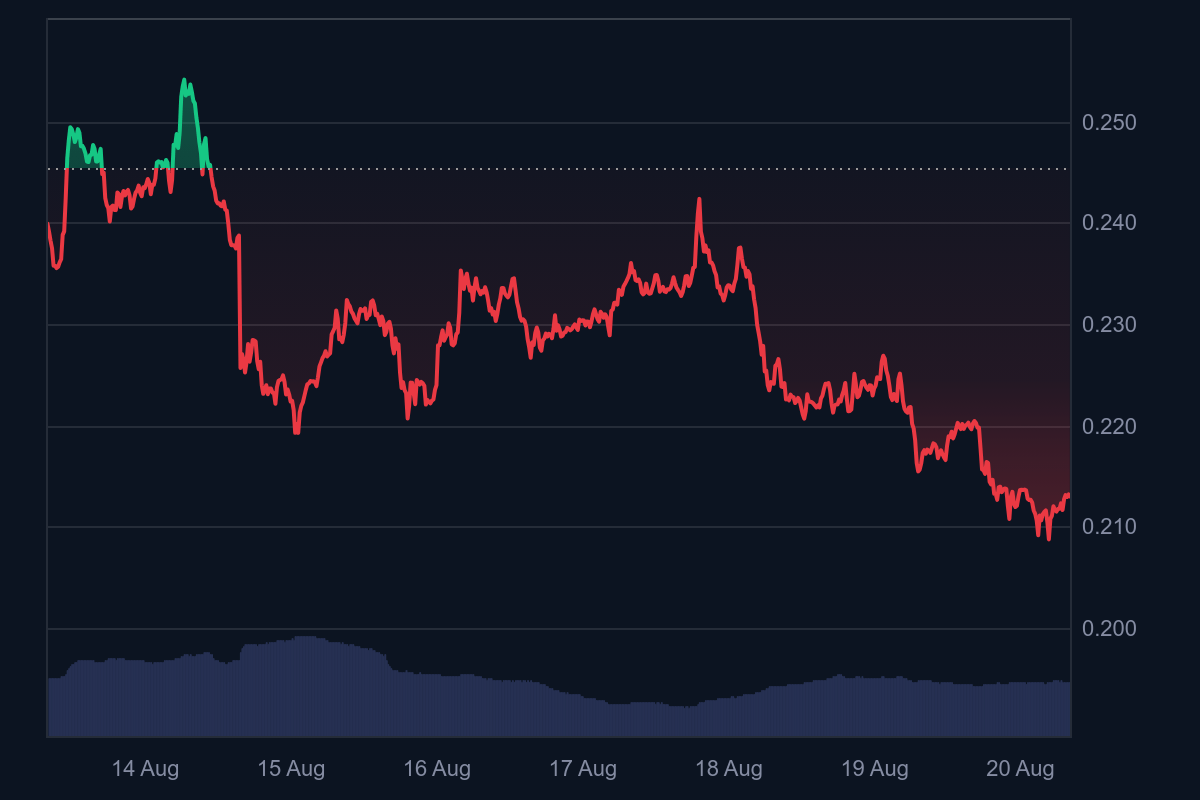
On the 12-hour chart, Dogecoin forms a symmetrical triangle with converging upper boundary at about $0.233 and lower support around $0.21. Analysts note that such formations often precede sharp moves. From its current level around $0.21, a 40% rise would take DOGE to nearly $0.30.
Key Fibonacci zones sit between $0.265 and $0.287, offering intermediate targets on the way up. If support at $0.21 fails, a drop toward $0.18–$0.19 becomes likely. Tracking these price boundaries gives traders clear zones to watch.
RECOMMENDED: Is Dogecoin A Good Investment And How to Buy DOGE?
Catalysts & Confirmation Signals
Confirmation depends on breakout accompanied by a volume spike. Analysts stress that the triangle breakout must align with heightened trading activity to hold credibility.
ETF interest adds context: Polymarket odds for a Dogecoin ETF approval stand at 75%, fuelling sentiment.
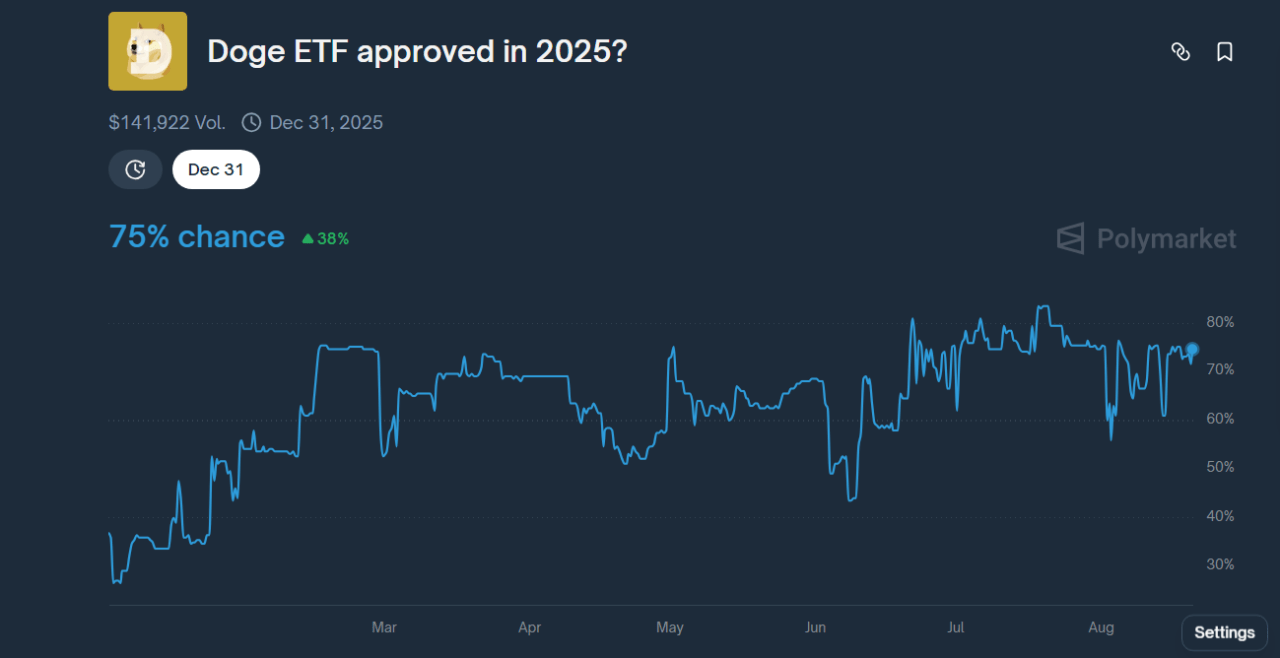
That optimism may support buyers pushing DOGE above the resistance cluster.
Still, a bearish Head-and-Shoulders shape appears on the 4-hour chart, warning not all signals favor the upside.
RECOMMENDED: What Could $1,000 in Dogecoin Be Worth in One Year?
Conclusion
Based on current Dogecoin technical analysis, DOGE now rests in a decisive technical zone. A breakout above $0.233 with strong volume could push DOGE toward $0.30, offering a clear path for upside.
Yet downside remains if support at $0.21 breaks or bearish formations prevail. Traders should monitor volume and key levels closely, as confirmation—or failure—of this triangle setup will likely dictate the coin’s short-term direction.
Buy DOGE With The Best Crypto Exchange for Intermediate Traders and Investors

Invest in cryptocurrencies and 3,000+ other assets including stocks and precious metals.
0% commission on stocks - buy in bulk or just a fraction from as little as $10. Other fees apply. For more information, visit etoro.com/trading/fees.
Copy top-performing traders in real time, automatically.
eToro USA is registered with FINRA for securities trading.
30+ million
Users worldwide
Don’t Miss the Next Big Move – Access Alerts Instantly
Join the original blockchain-investing research service, live since 2017. Our alerts come from a proprietary 15‑indicator methodology built over 15+ years of market experience. You’re following the service that identified major turning points through crypto winters and bull runs alike
Act now and see why thousands trust us to deliver signals before markets move.
This is how we are guiding our premium members (log in required):
- Crypto Shows More Resilience Than Expected. A Bullish Impulse May Be Underway. (Aug 9th)
- Prepare To Buy The Dip In Crypto (Aug 2nd)
- Alt Season 2025 – Progress Update (July 26th)
- This Is What Bullish Basing Patterns Look Like (Hint: Alt Season Starting) (July 20th)
- Is Alt Season 2025 Here? (July 15th)
- Alts Breakout Happening Now. These Are Price Time Combinations To Watch. (July 11th)


