Bitcoin and Ether pulled back from mid-August highs, creating tactical entry windows for disciplined buyers. Data, flows and on-chain signals should guide timing.
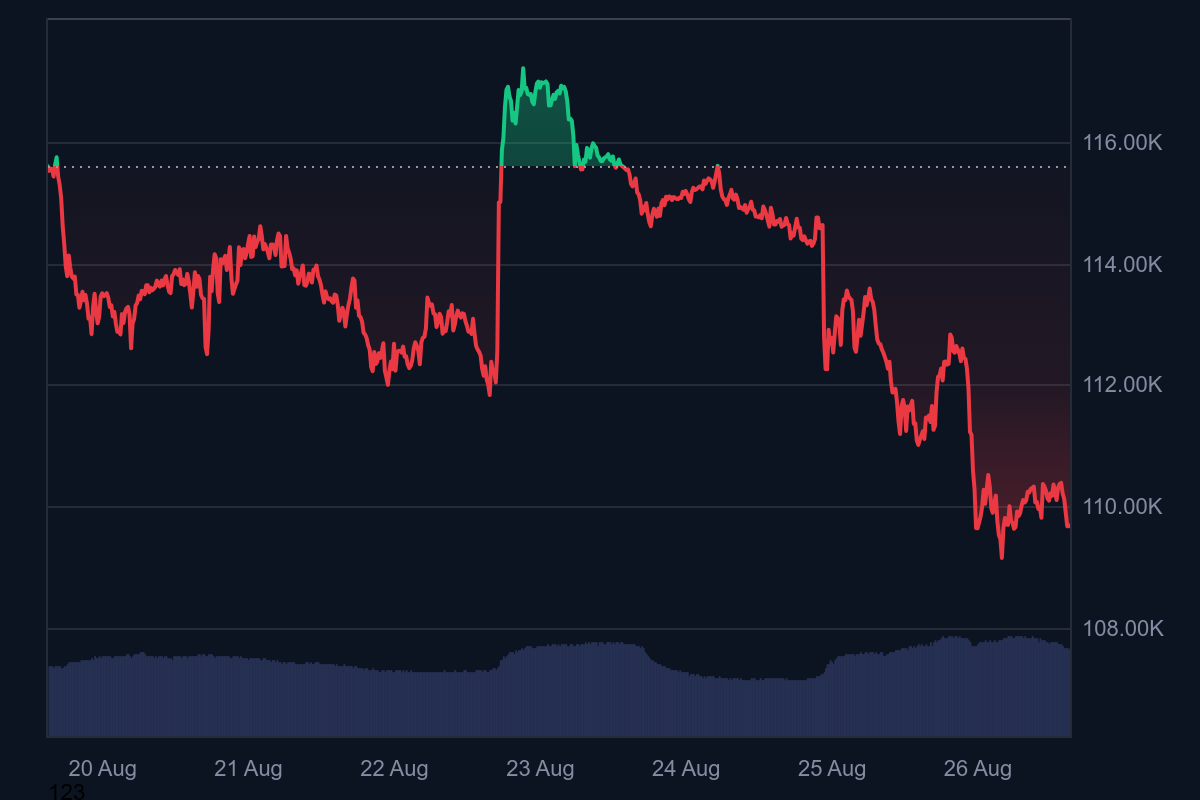
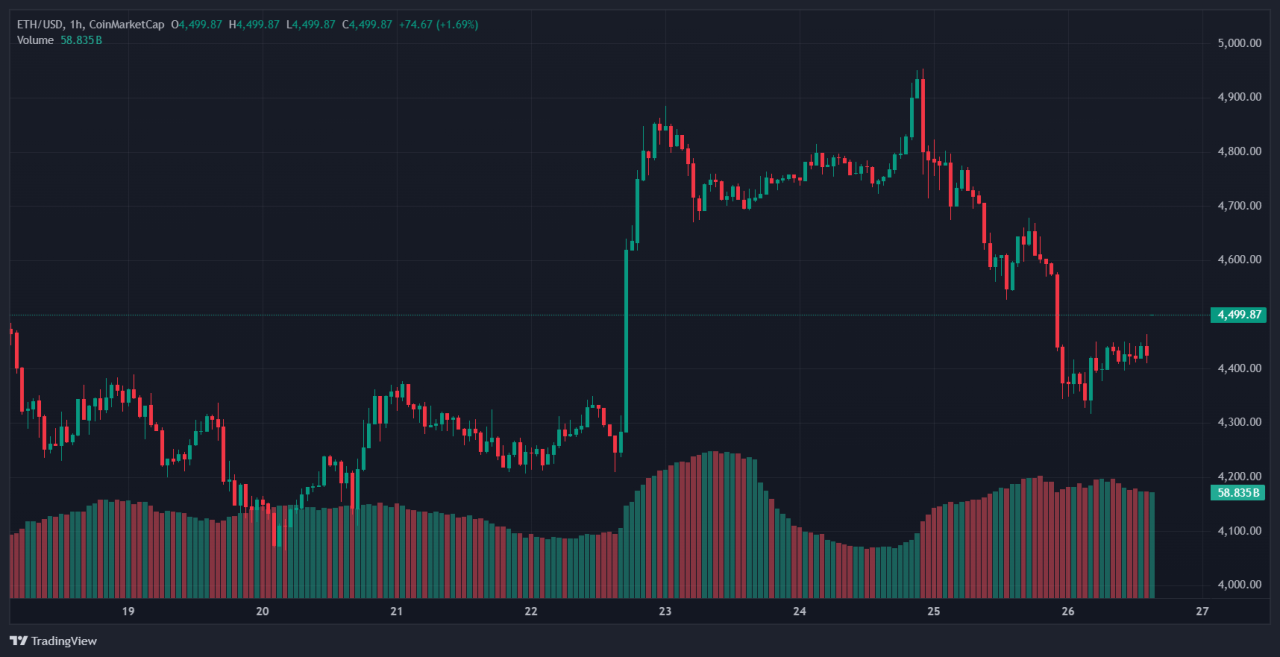
Bitcoin fell from a mid-August peak around $124,457 to about $110,200, down roughly 11% from the all-time high. Ether also retreated from new highs near $4,950. This article explains what happened, why prices moved, and how traders and allocators can assess whether to buy the dip in the short term.
People also read: Week Ahead: Can Bitcoin Sustain This All-Time High Momentum?
So, What Happened?
Bitcoin surged to a new record in mid-August just above $124k before the market reversed. Over the weekend a single large wallet sold roughly 24,000 BTC, triggering a rapid $4,000 intraday drop that wiped billions from market value.
The coin traded below $110k and saw long liquidations above $500m in aggregate.
ALSO READ: Bitcoin Warning: Further Pullback To $108,000 In Sight
Spot bitcoin and ether exchange-traded funds recorded large withdrawals over several sessions, totaling about $1.4–$1.9B depending on the dataset.
Ether peaked around $4,950 before pulling back. Volume spiked on the sell-off while order books thinned at the highs, magnifying price moves.
RECOMMENDED: Where will Ethereum (ETH) Be in 5 years?
Why It Moved: Short Drivers
Two immediate factors explain the drop. First, a concentrated liquidity shock from the 24,000 BTC sale overwhelmed thin order books, producing outsized slippage and rapid price declines.
Second, institutional flows swung negative, with spot Bitcoin and Ether funds posting roughly $1.9B of withdrawals over four sessions, signaling short-term risk aversion. Market commentary from the Federal Reserve reduced the probability of near-term rate cuts, prompting rebalancing across risk assets.
Short-term technicals printed lower momentum on the 14-day RSI, increasing the likelihood of a correction. Ethereum offered deeper liquidity, softening some selling briefly.
RECOMMENDED: Can You Create Wealth From Bitcoin?
Is This A Buy? Practical Checklist
For long-term allocators:
- size exposure to match risk tolerance
- prefer dollar-cost averaging rather than lump sums
- watch ETF net flows and large wallet movements
- monitor on-chain accumulation versus distribution
- set clear stop levels
For traders watch out for a clear intraday reversal, rising bid volume, and confirmation from ETF inflows before adding risk, and confirm macro signals.
RECOMMENDED: Thinking About Investing in Ethereum? Here’s Why It’s Not Too Late!
Conclusion
The dip creates tactical entry points for disciplined buyers who follow data. If you lack a checklist and risk controls, avoid impulse buys; wait for confirming flows, on-chain accumulation first.
Best Crypto Exchange for Intermediate Traders and Investors

Invest in cryptocurrencies and 3,000+ other assets including stocks and precious metals.
0% commission on stocks - buy in bulk or just a fraction from as little as $10. Other fees apply. For more information, visit etoro.com/trading/fees.
Copy top-performing traders in real time, automatically.
eToro USA is registered with FINRA for securities trading.
30+ million
Users worldwide
Don’t Miss the Next Big Move – Access Alerts Instantly
Join the original blockchain-investing research service — live since 2017. Our alerts come from a proprietary 15‑indicator methodology built over 15+ years of market experience. You’re following the service that identified major turning points through crypto winters and bull runs alike
Act now and see why thousands trust us to deliver signals before markets move.
This is how we are guiding our premium members (log in required):
- BTC Testing Long Term Trendline. Here Is Short and Long Term Guidance. (Aug 26th)
- Crypto – To Break Out Or Not To Break Out? (Aug 23rd)
- What Happened This Week? Leading Indicator Analysis and 7 Token Charts. (Aug 16th)
- Crypto Shows More Resilience Than Expected. A Bullish Impulse May Be Underway. (Aug 9th)
- Prepare To Buy The Dip In Crypto (Aug 2nd)
- Alt Season 2025 – Progress Update (July 26th)


