Solana and Ethereum both pulled back, yet their network profiles look very different. Usage favors Solana, liquidity favors Ethereum.
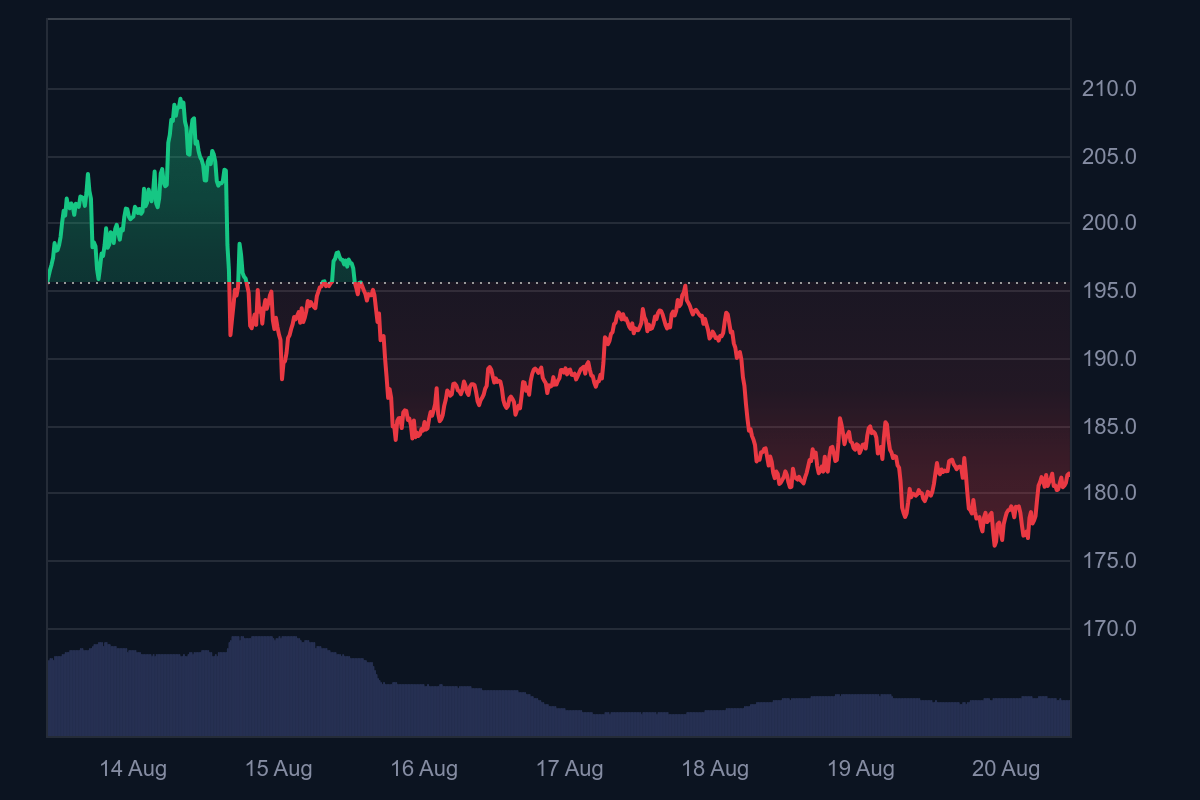
At the time of writing, Solana trades just above $188 and Ethereum around $4,421 according to data from CoinMarketCap.
Over the last 7 days, Solana’s range sits at $176.28 to $208.46, while Ethereum’s range sits at $4,080.65 to $4,776.32. That places Solana $20.46 below its weekly high and Ethereum $355.32 below its own.
These levels frame this week’s question, which asset can reclaim nearby resistance first.
Network Pulse: Users, Transactions, Liquidity
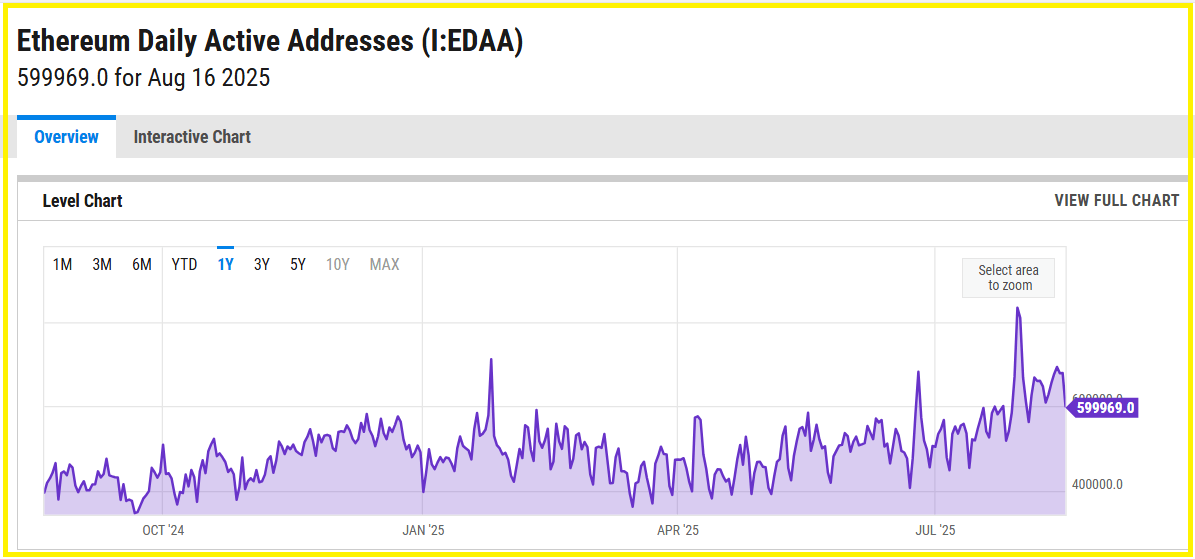
Solana continues to post heavy usage. Latest Artemis snapshots show roughly 814.5K daily active addresses and about 17.2M daily transactions. Ethereum’s daily active addresses sit near 600K, with transactions around 1.7M per day.
On trading flow, Ethereum currently leads decentralized exchange activity with roughly $5.58B in 24h DEX volume, while Solana posts about $3.51B. The split is clear, Solana processes more user interactions, Ethereum concentrates more trading volume.
For a weekly setup, that usage and liquidity mix helps explain why both assets can base at the same time, yet respond differently on risk-on sessions.
RECOMMENDED: Is It Worth Buying Solana In 2025?
Breakout Map: Levels And Setups
For Solana, the near-term test is a daily close back above $208.46, with the $176 to $182 band acting as first support from the 7-day range.
For Ethereum, the first objective is a close back above $4,776.32, with $4,080 to $4,150 as nearby support from the same weekly range. If Solana can reclaim $200 and hold it on volume, watch whether on-chain activity converts to higher DEX share.
If Ethereum keeps the DEX lead while price approaches $4.7K, liquidity could pull in follow-through buyers.
RECOMMENDED: Where will Ethereum (ETH) Be in 5 years?
Conclusion
This week’s battle is simple to track. Solana brings the heavier user and transaction counts, Ethereum holds the deeper trading venue footprint.
Monitor two checkpoints, Solana over $200 and Ethereum over $4.7K, then confirm with daily closes and any shift in DEX share. The side that clears resistance and sustains its edge in usage or liquidity should own the next leg.
Best Crypto Exchange for Intermediate Traders and Investors

Invest in cryptocurrencies and 3,000+ other assets including stocks and precious metals.
0% commission on stocks - buy in bulk or just a fraction from as little as $10. Other fees apply. For more information, visit etoro.com/trading/fees.
Copy top-performing traders in real time, automatically.
eToro USA is registered with FINRA for securities trading.
30+ million
Users worldwide
Don’t Miss the Next Big Move – Access Alerts Instantly
Join the original blockchain-investing research service, live since 2017. Our alerts come from a proprietary 15‑indicator methodology built over 15+ years of market experience. You’re following the service that identified major turning points through crypto winters and bull runs alike
Act now and see why thousands trust us to deliver signals before markets move.
This is how we are guiding our premium members (log in required):
- Crypto Shows More Resilience Than Expected. A Bullish Impulse May Be Underway. (Aug 9th)
- Prepare To Buy The Dip In Crypto (Aug 2nd)
- Alt Season 2025 – Progress Update (July 26th)
- This Is What Bullish Basing Patterns Look Like (Hint: Alt Season Starting) (July 20th)
- Is Alt Season 2025 Here? (July 15th)
- Alts Breakout Happening Now. These Are Price Time Combinations To Watch. (July 11th)


