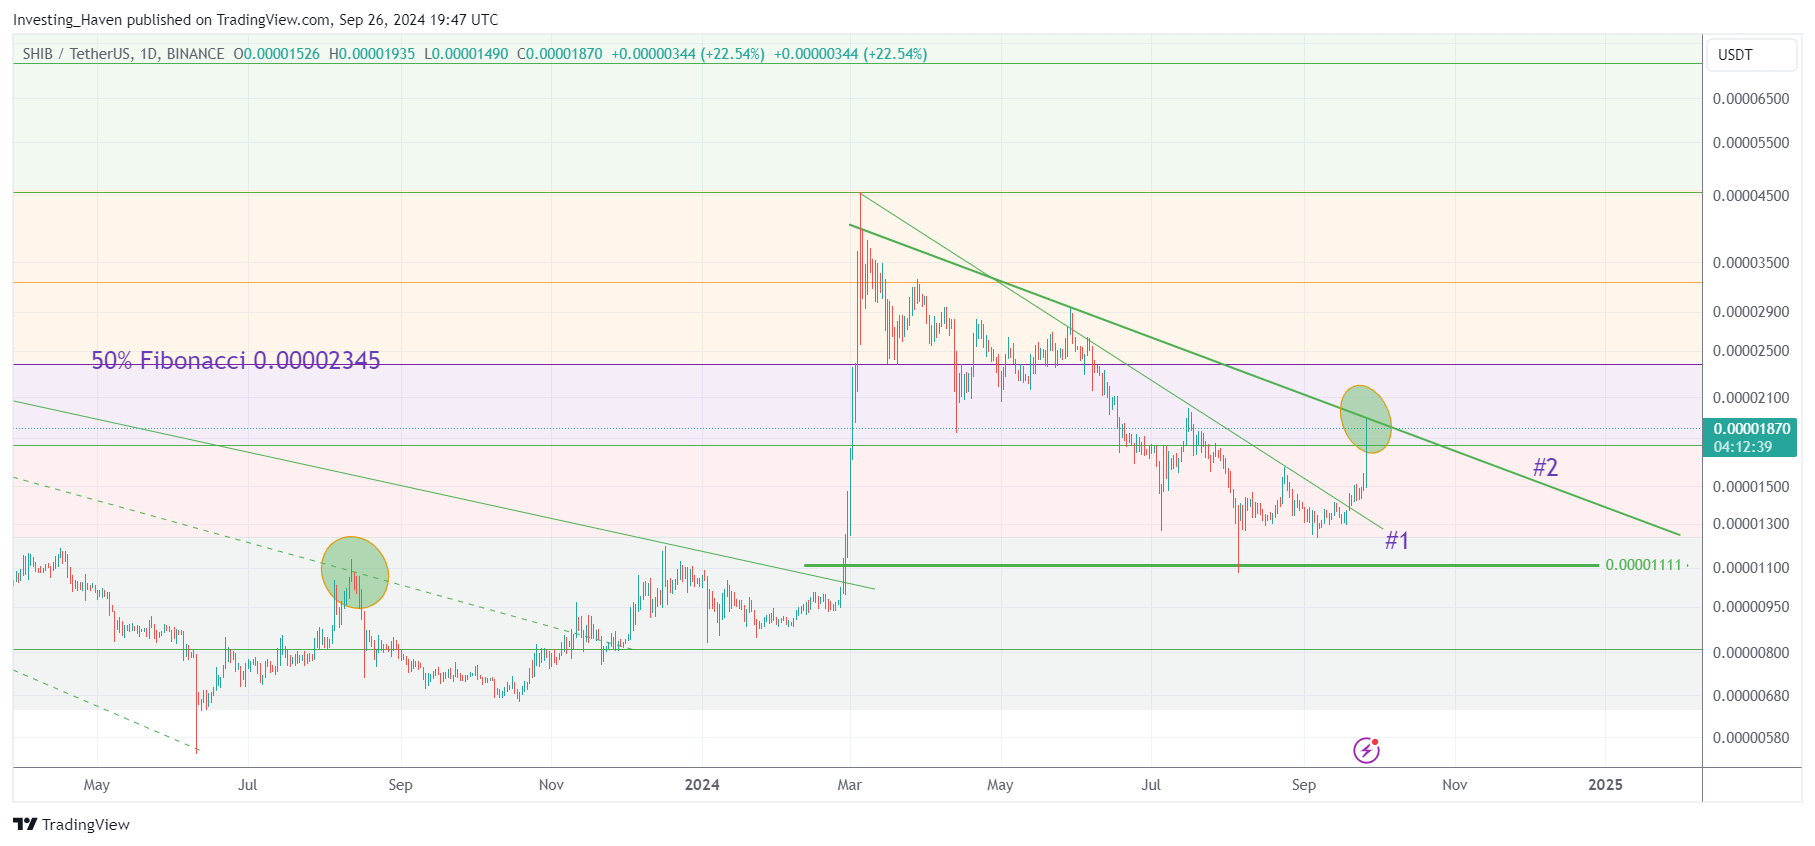
Today’s rise of 20% in the price of Shiba Inu Coin (SHIB) brings up the question whether SHIB is breaking out. Chart patterns are mixed: yes and no is the answer to the question whether a breakout is happening in SHIB.
In this article, we review the daily SHIB price chart from our Shiba Inu (SHIB) price prediction research.
Is Shiba Inu breaking out?
First things first – what is a breakout?
This might sound like the most basic question to ask – why would we ask this question.
The truth is that ‘breakout’ is used by ‘everyone and his Uncle’ nowadays:
- Especially on X, the cash tag $SHIB is full of breakouts.
- Breakouts are visualized on all sorts of SHIB charts.
- Filtering out emotions like excitement leaves an astute reader completely confused.
Compounding this problem is the fact that many short term timeframes are used to show SHIB breakouts.
So, really, what is a SHIB breakout?
In our view, it is a confirmation of a trend change:
- From downtrend to consolidation.
- Or from consolidation to uptrend.
A breakout is only meaningful on the daily chart or higher timeframes.
Any ‘breakouts’ on lower timeframes are best case meaningless, worst case confusing (read: noise).
Shiba Inu price chart
The daily SHIB price chart from our Shiba Inu Coin prediction research is shown below.
A few observations, critical to understand whether SHIB is breaking out:
- There are 2 falling trendlines on this chart.
- Just the fact that there are falling trendlines suggest that it’s pointless to think in ‘breakout’ terms.
- Trendline #1 (see chart) got cleared about a week ago. In a way, it was a ‘breakout’.
- Trendline #2 is providing too much resistance, even after today’s 20% rally.
The chart says it all – while a ‘breakout’ occurred last week, ending one trendline, there is a stronger trendline that is preventing SHIB from moving higher.

Shiba Inu chart structure
Is Shiba Inu breaking out? Partially, or softly, but not decisively, at all.
SHIB is looking increasingly more constructive. But there is more time needed for a breakout that turns a downtrend into an uptrend, is what this chart suggests.
Ultimately, the big moment will come for SHIB, it is clear from this chart.


